Measure And Optimize Largest Contentful Paint (LCP)
The Largest Contentful Paint (LCP) metric is a web performance indicator that measures how quickly the main content of a website becomes visible to users. LCP marks the rendering milestone when visitors can see the largest page element.
The LCP is one of the three Core Web Vitals Google uses as part of its search rankings, along with Cumulative Layout Shift and Interaction to Next Paint.
This article explains what the LCP metric measures, how to check it on your website, and how to optimize it.
What is the Largest Contentful Paint?
The Largest Contentful Paint measures how long it takes for a website to display its biggest single content element. It's one of the most common ways to measure page load time.
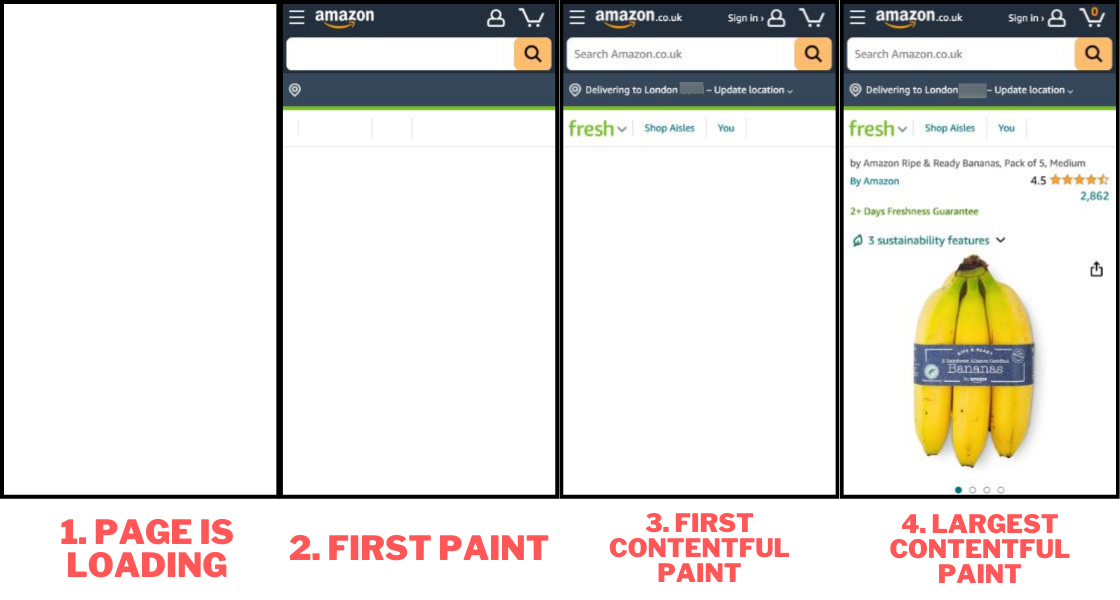
Like the First Paint and First Contentful Paint metrics, LCP is a paint timing metric that marks a rendering milestone in the page load process.
Contentful means that content like text or an image was rendered, rather than just showing empty boxes or full-size background images.

In the website filmstrip above, the LCP element is a piece of text, but it's also common for the LCP to be caused by an image like in the example below.
Images tend to be large files that are loaded after the initial page load, so optimizing LCP images can be more difficult than making sure that text loads quickly.
What elements can be the LCP element?
Only certain types of content are considered when the browser looks for the largest element in the viewport:
| Element type | What counts |
|---|---|
<img> elements | The rendered image. For animated GIFs and animated PNGs the first frame counts |
<image> elements inside an inline <svg> | The embedded raster image |
<video> elements | The poster image, or the first frame of an autoplaying video if there is no poster |
Elements with a CSS background-image | Only images loaded with url(), not CSS gradients |
| Block-level elements containing text | Paragraphs, headings, list items, and other elements that contain text nodes |
Some elements are ignored even if they are large. Full-viewport background images don't count, and neither do elements with opacity: 0 or very low-detail placeholder images, such as a solid color image stretched across the screen. Only the part of the element that's visible in the viewport is measured, so an image that extends below the fold is only counted at its visible size.
What is the difference between First Contentful Paint and Largest Contentful Paint?
First Contentful Paint (FCP) measures when the browser renders the first piece of content from the DOM, whether that's a line of text, an image, or a small icon. Largest Contentful Paint measures when the biggest content element in the viewport has rendered. FCP tells you when the page starts to render, LCP tells you when the main content is visible.
FCP always happens at the same time as LCP or before it. Both metrics depend on the Time to First Byte and on render-blocking resources like CSS, because nothing can render before those have loaded.
LCP additionally depends on how quickly the largest element itself becomes available, for example how long it takes to download a hero image or a web font.
Unlike LCP, FCP is not a Core Web Vital. It still contributes 10% of the Lighthouse Performance score, compared to 25% for LCP. A good FCP is 1.8 seconds or less, and an FCP over 3 seconds is considered poor.
When FCP and LCP are the same
FCP and LCP can have the same value. This happens when the largest content element is part of the very first render. For example, a page whose LCP element is a heading that's included in the HTML, styled with a system font, will typically render the heading as soon as the stylesheets have loaded. The first paint and the largest paint are then the same frame.
The same can happen with an LCP image if it's already available when the page first renders, for example because it's inlined as a data URI or was already in the browser cache.
If FCP and LCP are equal and LCP is still slow, optimizing the LCP element itself won't help. Instead, focus on what delays the first render: slow server responses and render-blocking requests.
When there's a large gap between FCP and LCP
A big difference between FCP and LCP means the page starts rendering but the main content shows up later. Common causes are a large image that's only discovered after the initial render, a web font that delays text rendering, or client-side JavaScript that inserts the main content after the page has loaded. The LCP sub-parts breakdown tells you which of these is responsible.
What is a good Largest Contentful Paint?
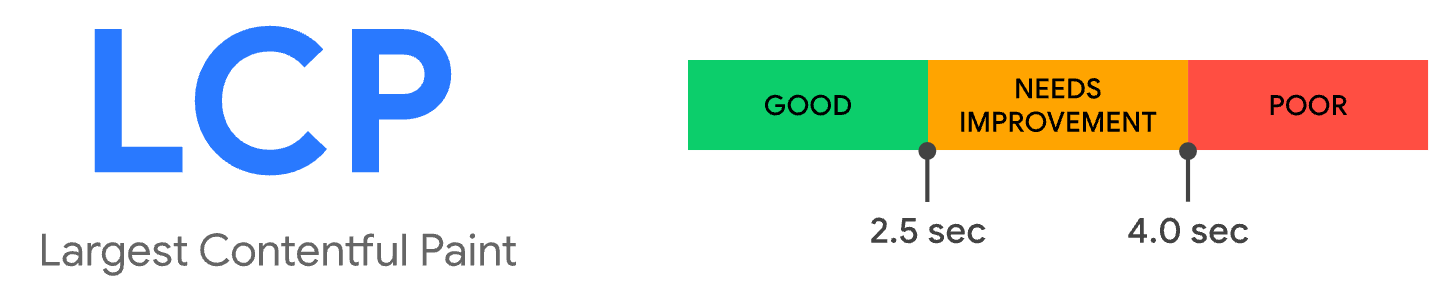
For optimal user experience and search engine performance, websites should aim for an LCP of 2.5 seconds or less.
Google rates LCP in three tiers:
| Rating | LCP |
|---|---|
| Good | 2.5 seconds or less |
| Needs improvement | Between 2.5 and 4 seconds |
| Poor | More than 4 seconds |
A poor LCP can worsen your search rankings and user experience.
To pass the Core Web Vitals assessment, 75% of page loads need to have a good LCP. In other words, the 75th percentile of your real-user LCP data needs to be 2.5 seconds or less. The thresholds are the same for mobile and desktop, but Google evaluates them separately for each device type.
Measuring Largest Contentful Paint
Here are some useful tools and techniques to help you analyze, debug, and fix your LCP:
- The DebugBear Website Speed Test
- PageSpeed Insights
- Chrome DevTools
- The Largest Contentful Paint API
- DebugBear real user monitoring
- Google Search Console
Continue reading to learn how to check, measure, and analyze the LCP of a website.
DebugBear website speed test
Enter your website URL in the free DebugBear speed test to measure your Largest Contentful Paint score and get customized recommendations to optimize LCP.
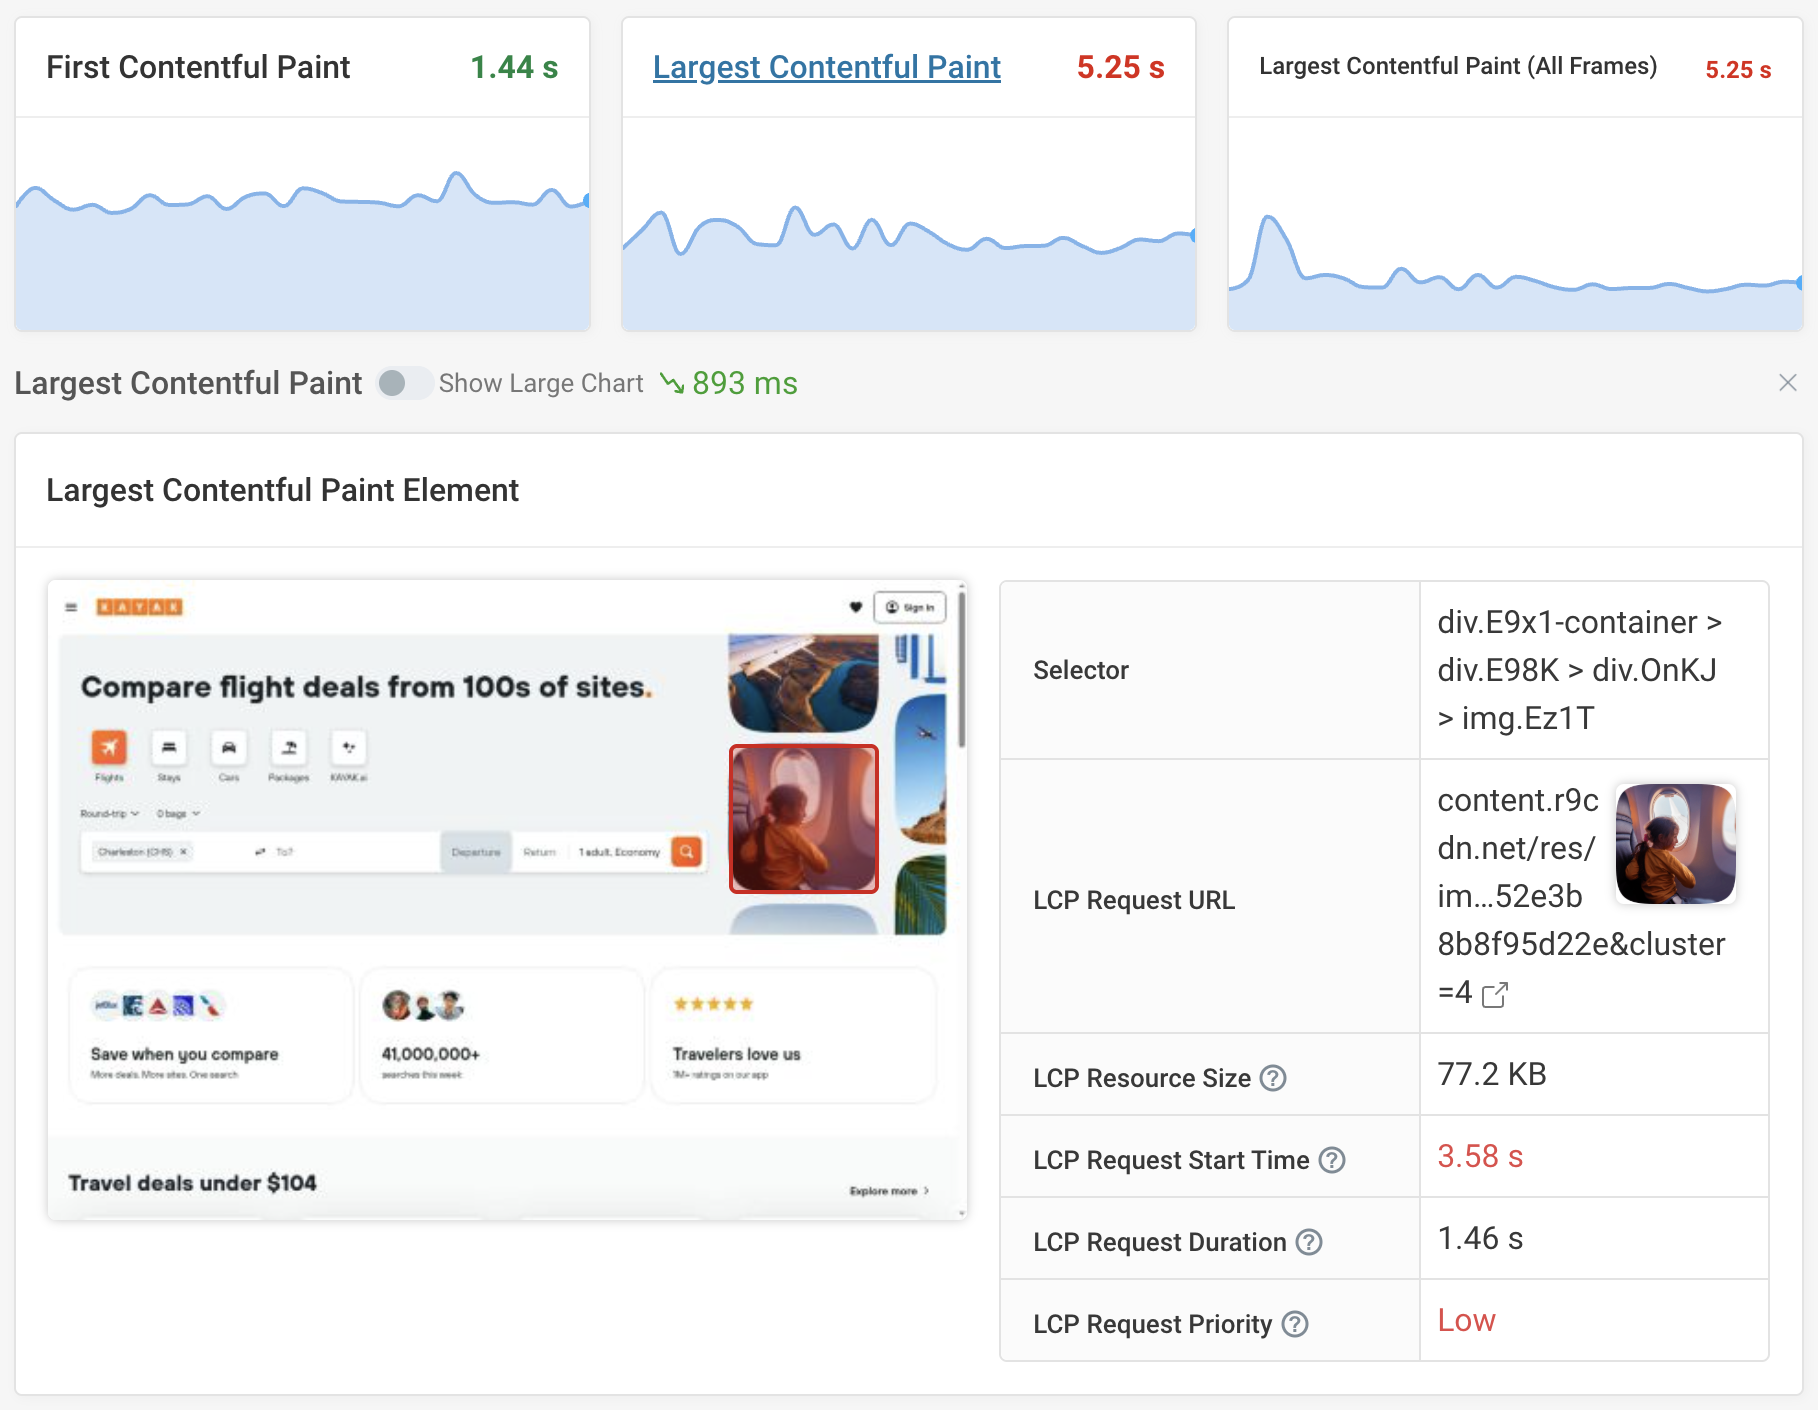
Our LCP checker shows you what the largest element on the page is and what resources are involved in loading it.
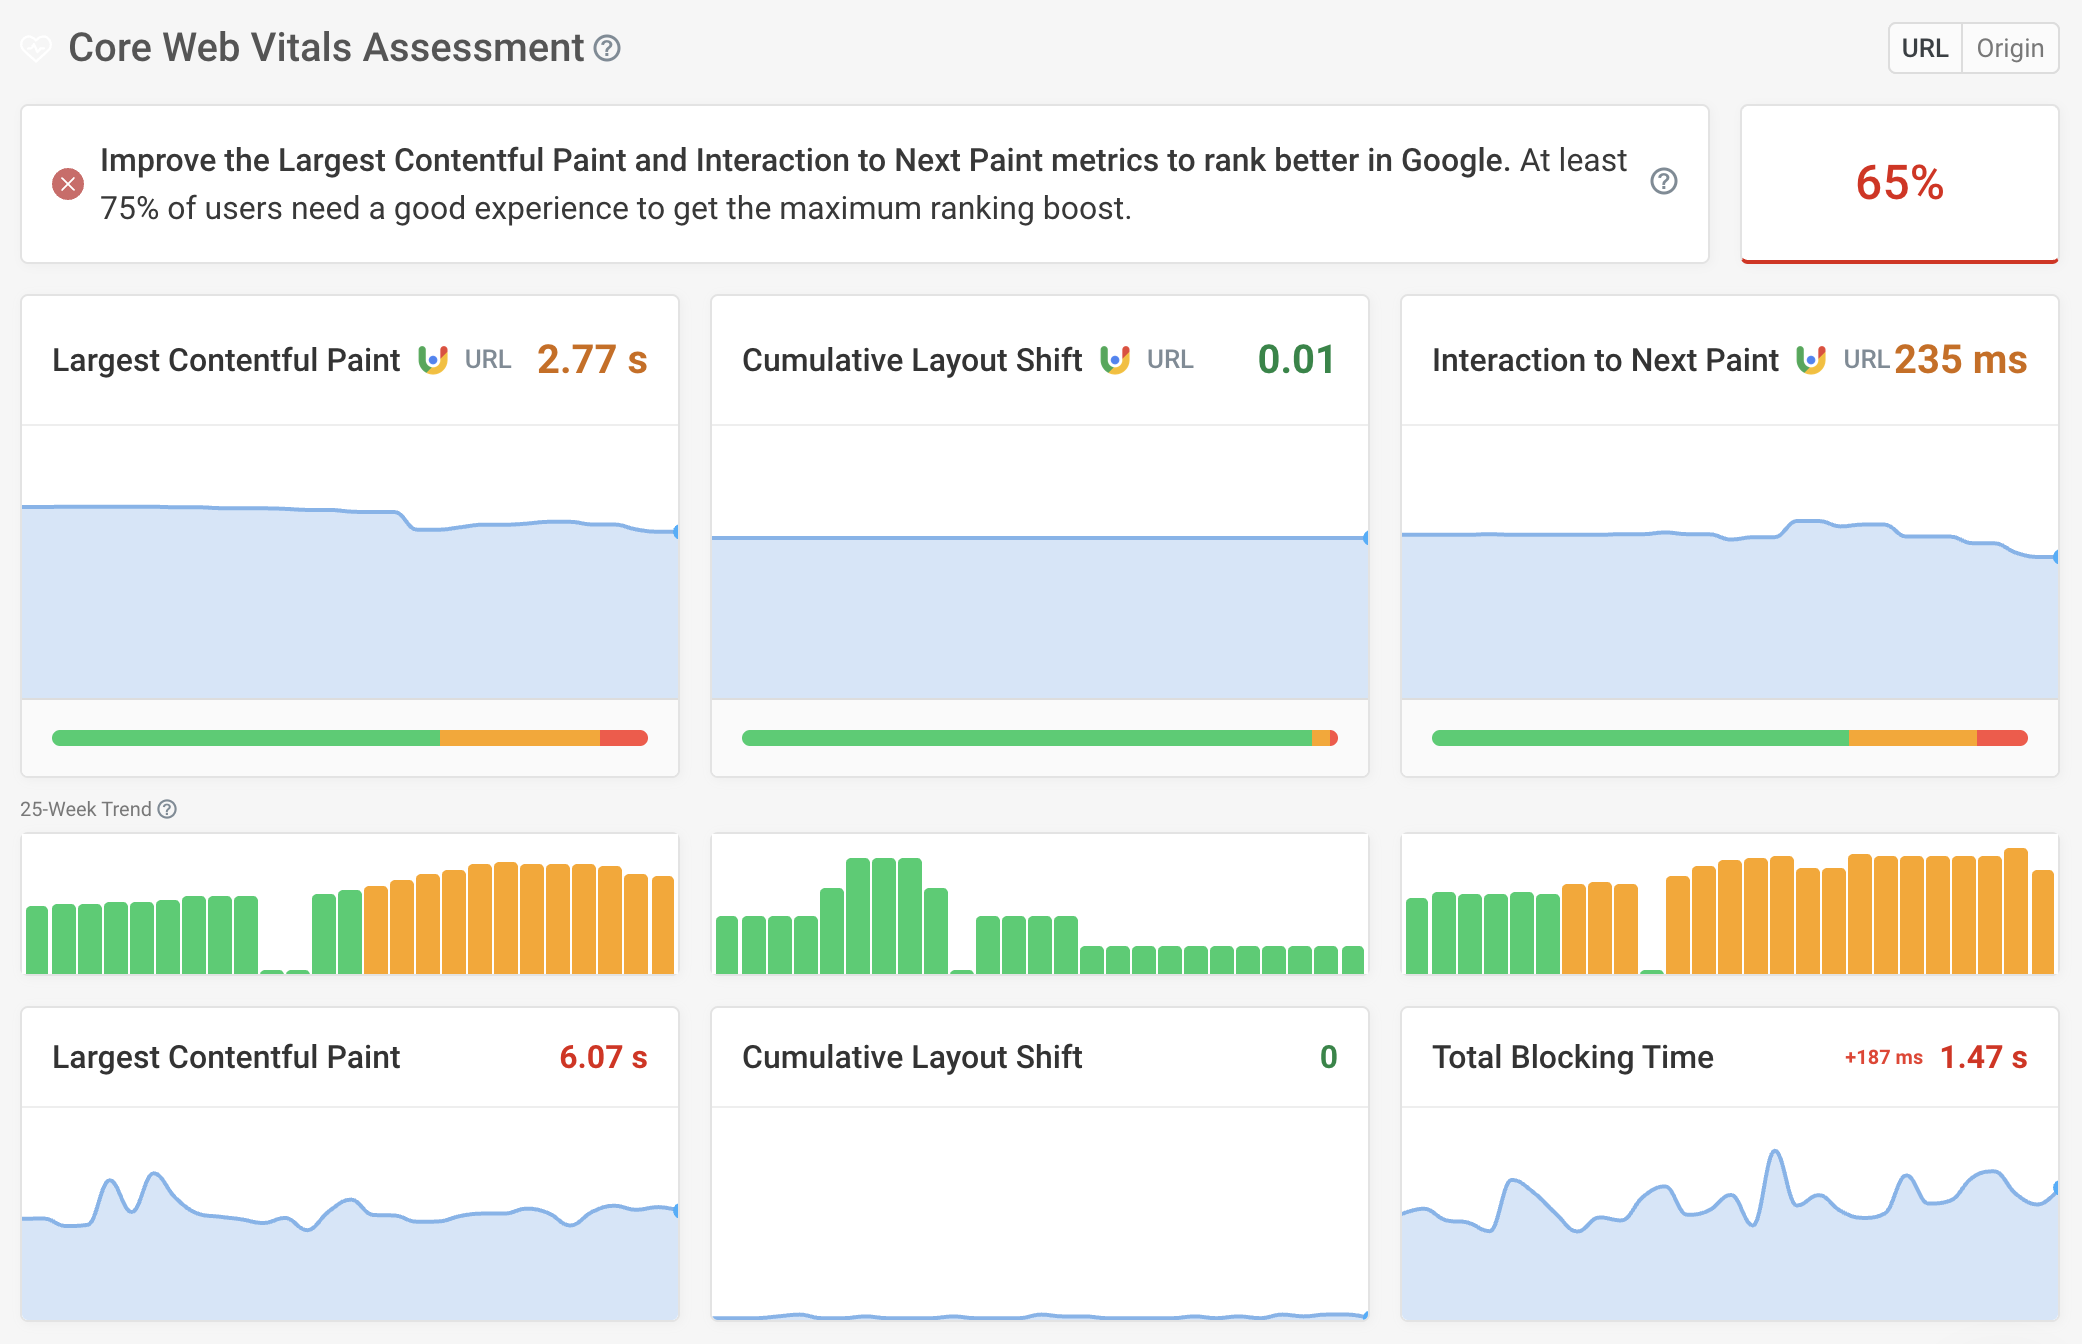
The Web Vitals tab also provides real user trend data for the last 40 weeks. This data comes from real Chrome users that Google collects as part of the Chrome User Experience Report (CrUX).
CrUX data is only available for websites and pages that get enough traffic. It's very useful because it tells you how real visitors experience your website. However, it also has some limitations:
- Data updates slowly, always reporting a 28-day rolling average
- Only metrics are reported, without diagnostic data
PageSpeed Insights
Google's PageSpeed Insights (PSI) makes it easy to measure the Largest Contentful Paint on your website.
PageSpeed Insights reports real user data that Google has already collected and also triggers an on-demand lab-based test of your website. The report shows these as real user and diagnostic data respectively.

Google uses a fairly slow network connection in the lab test, so your metrics will usually be slower in the lab than they are for real users. For example, for YouTube, the field LCP is 3.1s, while the lab test returns a value of 7.8s.
The lab test is run using Google Lighthouse, so the PSI report also provides a deeper page analysis that highlights opportunities for improvement.
The report shows you additional metrics that tell you about your page load performance. For example, Speed Index looks at the overall rendering time of your page, unlike the LCP metric that measures when a specific page element appears.

Finding the LCP element in the Lighthouse report
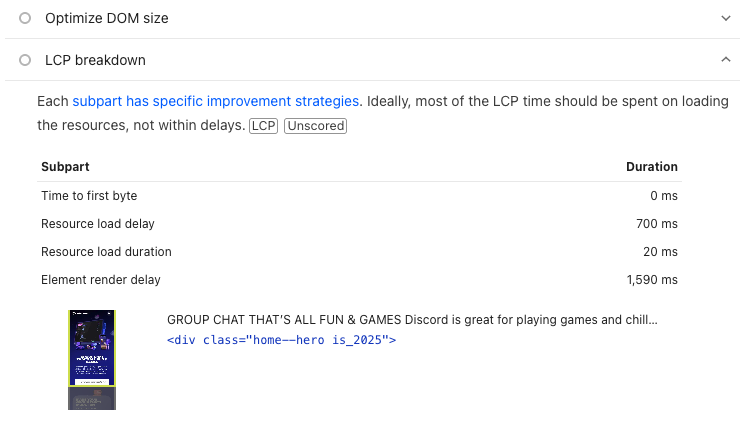
You can find the element that caused the Largest Contentful Paint in the Lighthouse report insights under LCP breakdown.
The subpart breakdown often doesn't add up to the total reported LCP score. That's because the LCP score is based on simulated throttling while the subparts are based on observed data.
Chrome DevTools
Run a Performance recording in Chrome's developer tools and you'll find the Largest Contentful Paint in the Timings track. Clicking the LCP marker highlights the element causing that paint on the page.
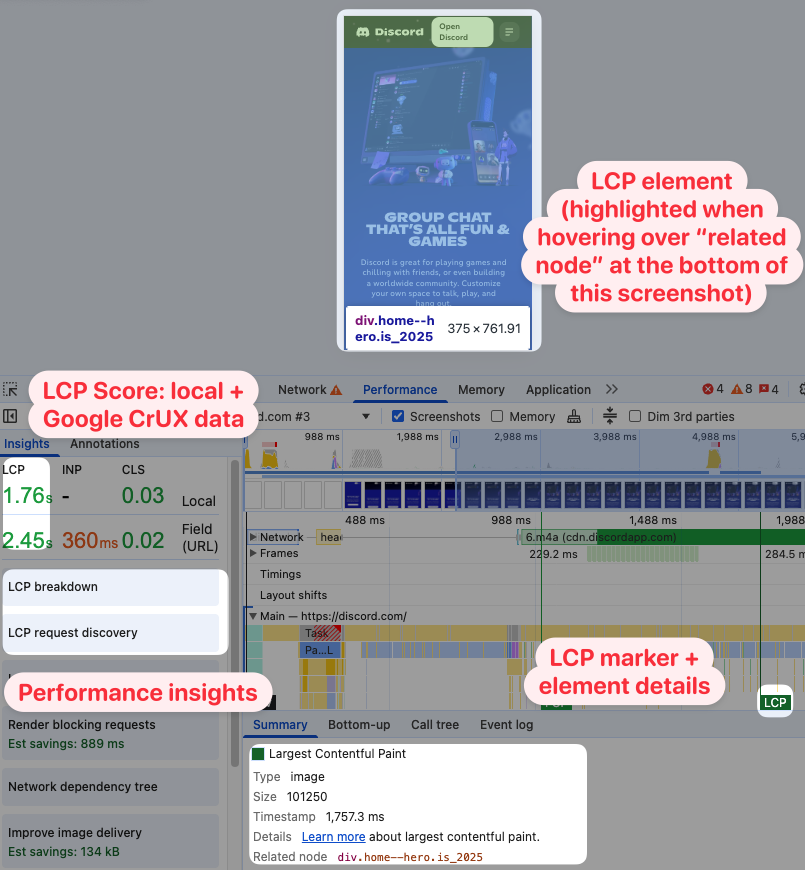
In the sidebar on the left, DevTools also shows a number of performance insights that can help you speed up your website.
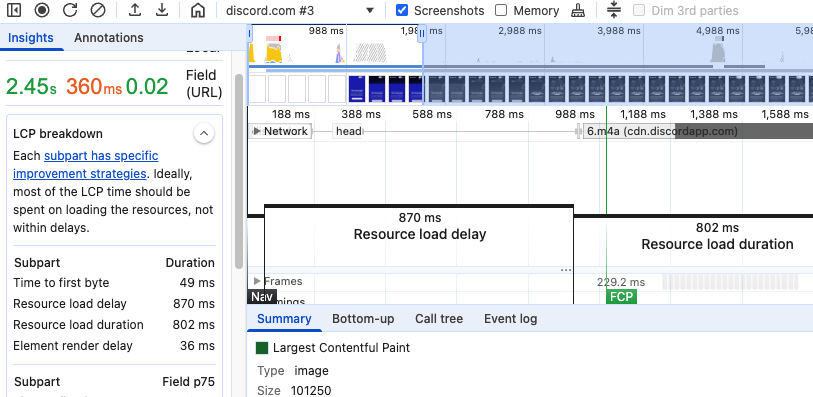
For example, the LCP breakdown shows you how much different components contribute to the overall LCP score. In this example we can see both high resource load delay and high resource load duration. That tells us that it takes a long time for the browser to discover the LCP image, and that downloading the image also takes almost a full second.
Using the Largest Contentful Paint API
You can use a PerformanceObserver to access the LCP of a page that's open in your browser. Paste the following script in the console of your browser's developer tools:
let lastLcp;
const po = new PerformanceObserver((entryList) => {
  const entries = entryList.getEntries();
  for (const entry of entries) {
    if (entry.startTime !== lastLcp) {
      console.log(
        `New LCP: ${entry.startTime}ms
Size: ${entry.size} px^2
URL: ${entry.url || "N/A"}
Element: `,
        entry.element,
        "\nFull entry: ",
        entry,
      );
      lastLcp = entry.startTime;
    }
  }
});
po.observe({ type: "largest-contentful-paint", buffered: true });
Every time the Largest Contentful Paint is updated you'll get a message in the console showing the element HTML and the size of the element.

Measure real user LCP with DebugBear RUM
DebugBear Real User Monitoring (RUM) lets you install an analytics snippet on your website and see how fast your website is for your visitors.
DebugBear collects data across your whole website, making it easy to identify slow pages. You can also look at a map showing LCP across the world to identify specific countries where your website is slow.
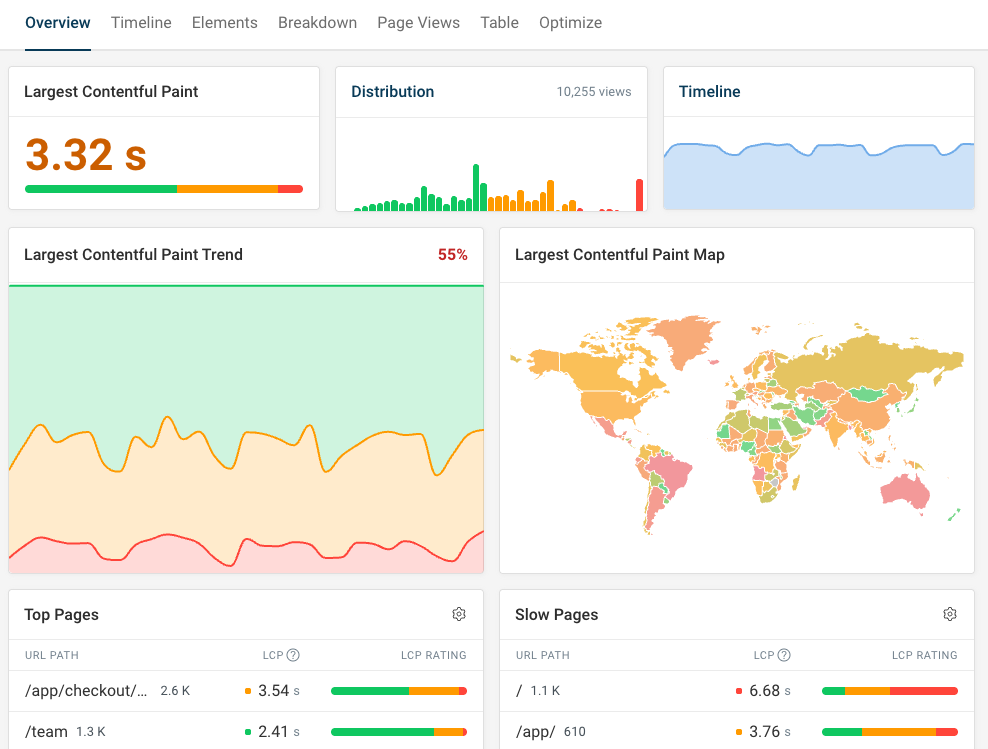
The largest element on your page will vary for different groups of visitors, depending on screen size, login state, or initial scroll position. With just synthetic tests this is often hard to identify.
DebugBear RUM provides a breakdown showing you the most common LCP elements and whether they need to be optimized. You can then inspect each one to view specific page views where that element was responsible for the LCP. Based on the device details you can then replicate any performance issues the visitor encountered.
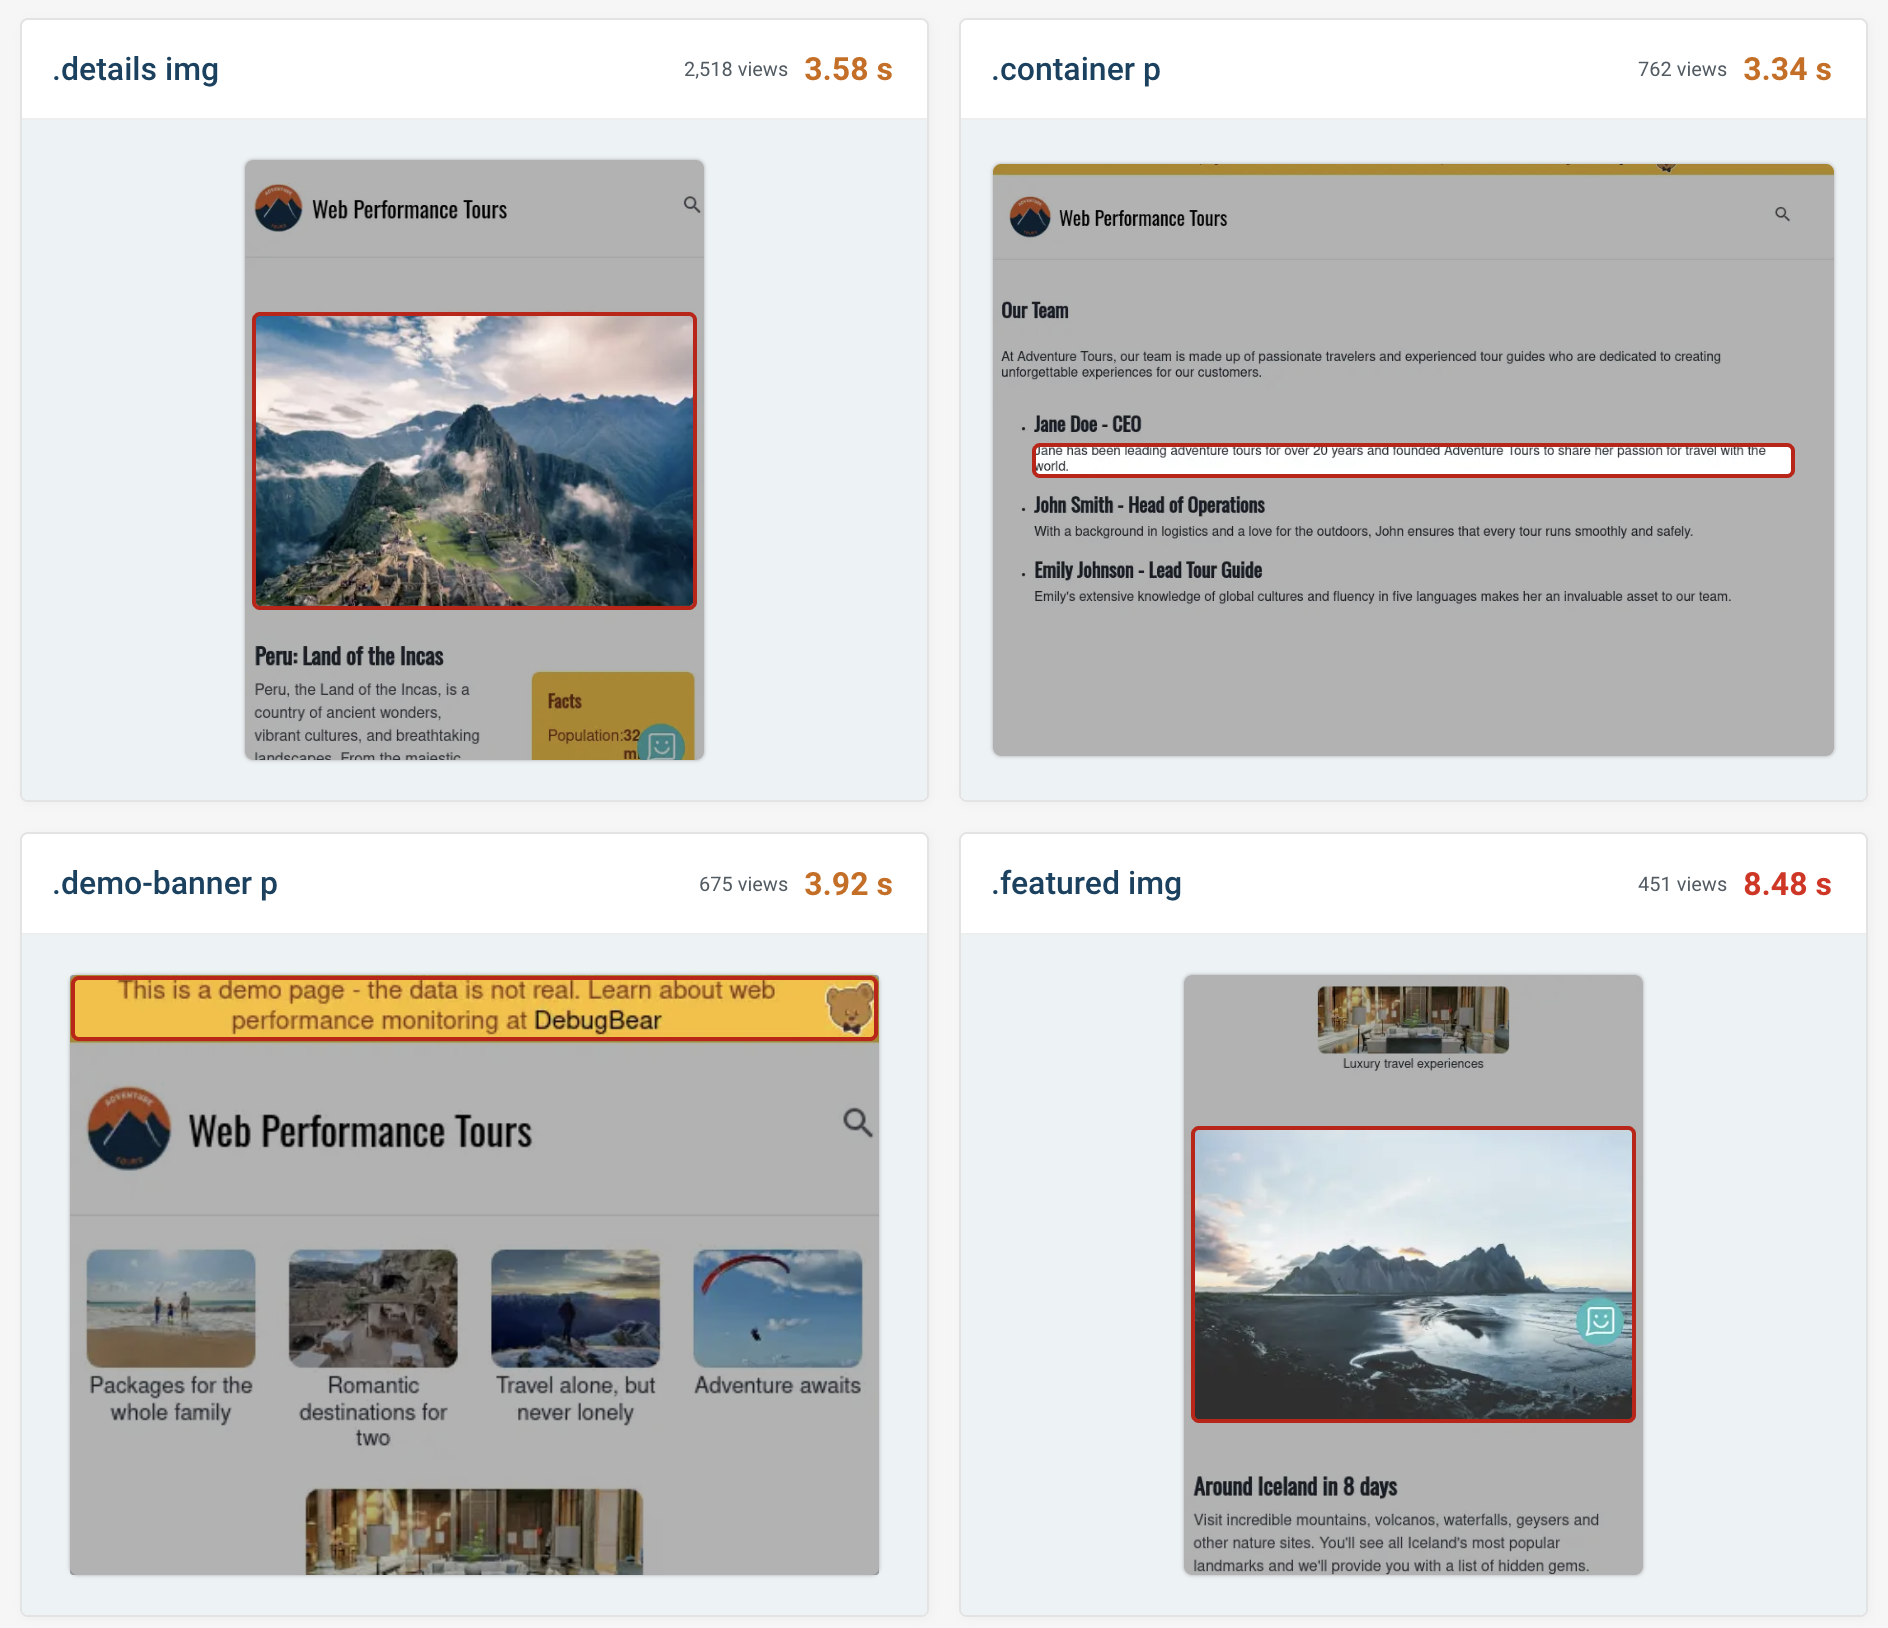
Largest Contentful Paint in Google Search Console
Google uses the LCP metric as a ranking factor, so reducing it can improve your site's SEO.
Search Console can help you identify pages with a poor LCP. Select Core Web Vitals in the sidebar, then Open Report for either the mobile or desktop data.
You can click on each reported issue to see example URLs where LCP needs improvement. Note that Search Console groups similar pages together, so the data you see doesn't always apply to that specific page URL.

How to improve Largest Contentful Paint
Follow this step-by-step guide to optimize your website's LCP, boost overall page speed, and potentially improve your search engine rankings:
- Identify the content element responsible for the Largest Contentful Paint
- Check what's blocking the element from showing up earlier
For example, your LCP could be delayed by slow server responses, render-blocking requests that hide page content, or a slow-loading image.
Identify the Largest Contentful Paint element
To optimize the LCP metric and improve your website's performance, you first need to pinpoint the specific element responsible for the Largest Contentful Paint.
You can do that using different performance tools, including the DebugBear website speed test, Google's PageSpeed Insights tool, Lighthouse, and Chrome DevTools. See the measurement section above for details on how to do this with different tools.
The DebugBear test result shows the LCP element in the Overview tab.
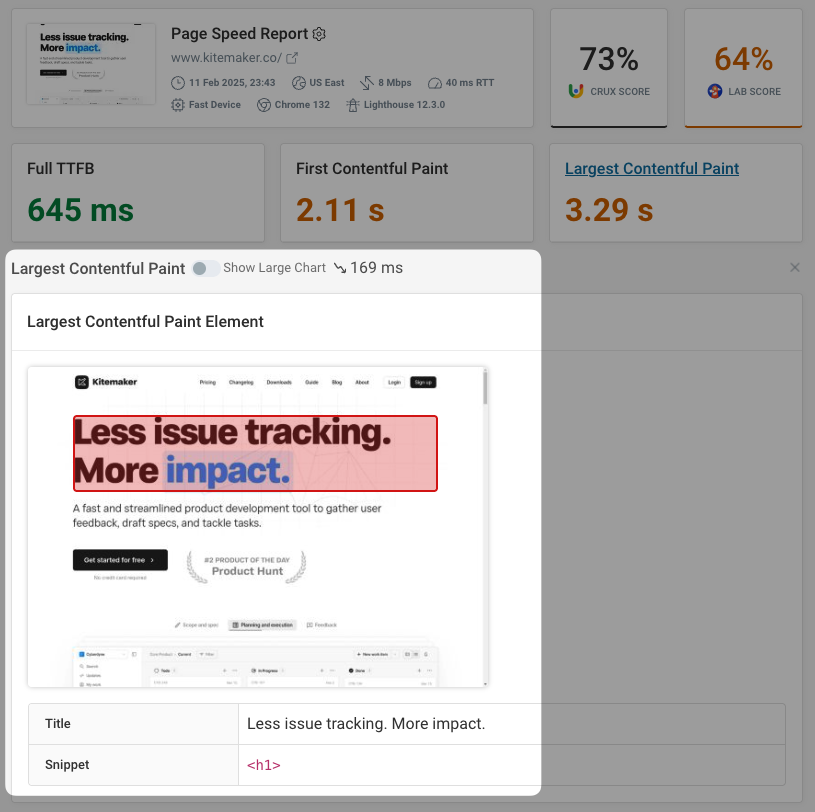
Identify what's blocking the Largest Contentful Paint
Let's say you see that the Largest Contentful Paint happens after 3 seconds. Why is that? What's blocking it so that it doesn't happen after, say, 2 seconds?
You need to identify the chain of requests that leads to the largest paint on your page.
Some of the potential optimizations here will apply to all LCP elements, while others are specific to the type of content that's causing the LCP (for example text or images).
Optimize server response time
Loading a website always starts by loading an HTML document. Before the browser starts downloading the document, no content can be displayed.
You can check if server response time is an issue by looking at the Time to First Byte (TTFB) metric. The TTFB should be below 800 milliseconds.
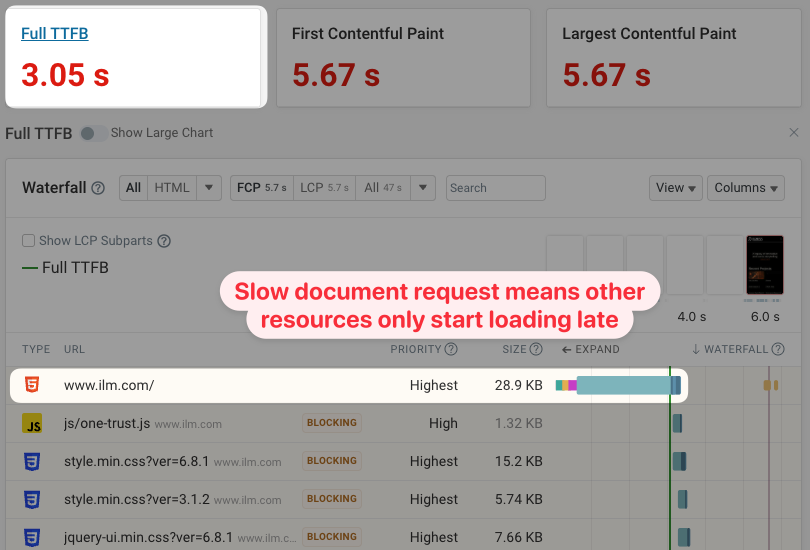
Reduce render-blocking resources
Render-blocking resources prevent all page content from rendering. Finishing these critical requests therefore puts a lower bound on when your largest content element can appear.
Tools like Lighthouse or DebugBear can tell you what requests on your page block rendering.
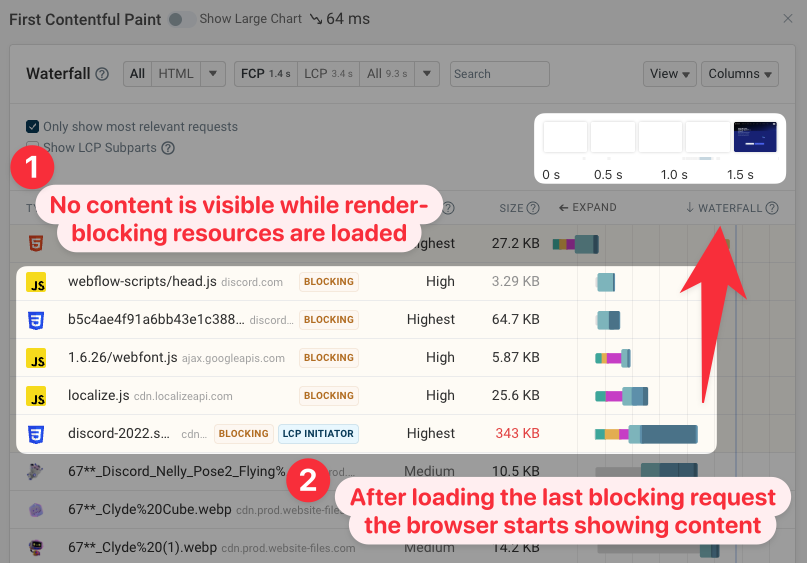
CSS stylesheets are generally render-blocking (in order to prevent a flash of unstyled content before the styles are loaded). Avoid using @import in your CSS files as it creates sequential CSS request chains.
JavaScript files can also be render-blocking. However, adding the async or defer attribute, or placing the script at the bottom of the page, avoids this problem. Minimize render-blocking scripts on your website as JavaScript application code generally isn't required for the initial render of the page.
Parser-blocking requests only block rendering of content that's placed below them in the HTML document.
Have all render-blocking requests finished but no content is showing up? Consider whether an anti-flicker snippet is blocking rendering.
Keep in mind that the document request is also always render-blocking, so reducing the Time to First Byte of your server response will also improve the Largest Contentful Paint.
Optimize LCP images
Large hero images or videos, while visually impactful, are often the culprits behind poor Largest Contentful Paint scores. In this case you need to find out what the media URL is and how you can make that network request finish faster. In DebugBear, the LCP image is highlighted in the request waterfall with an LCP badge.
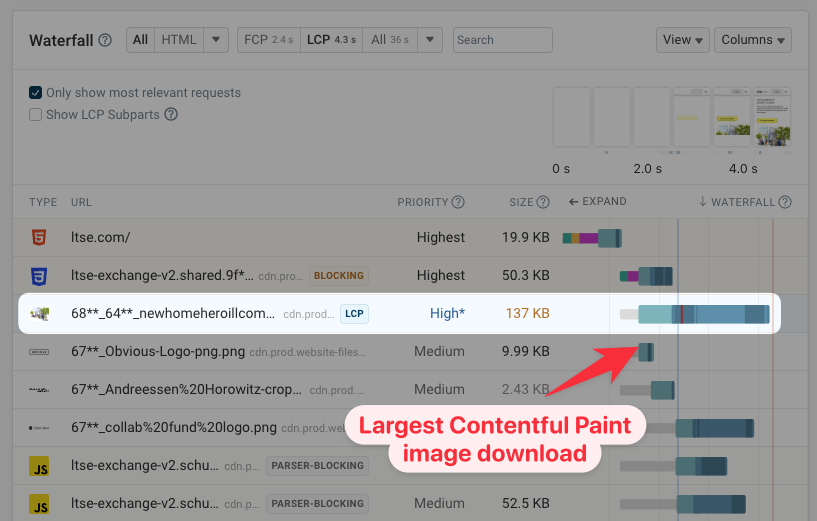
How can you make the image load faster?
- Image compression: a smaller image file will take less time to load than a large one. Make sure the image doesn't have unnecessarily large dimensions, and use modern formats like WebP and AVIF to speed up the largest image.
- Shorten request chains: check the request initiator to see if the image is referenced in the body HTML of the document. If it isn't, investigate how to speed up the resource that does initiate the LCP image request.
- Avoid new server connections: if you load the document from example.com and the LCP image from image-cdn.com then the browser will need to establish a server connection to the other server before starting the image download. If a server connection is reused then this is not necessary, typically saving three round trips on the network.
- Preload the LCP image: Preloading a resource helps the browser discover it sooner, while adding a fetchpriority attribute prioritizes the download.
Let's take a look at an example request waterfall for the Substack homepage. We can click on the LCP image request to reveal more information.
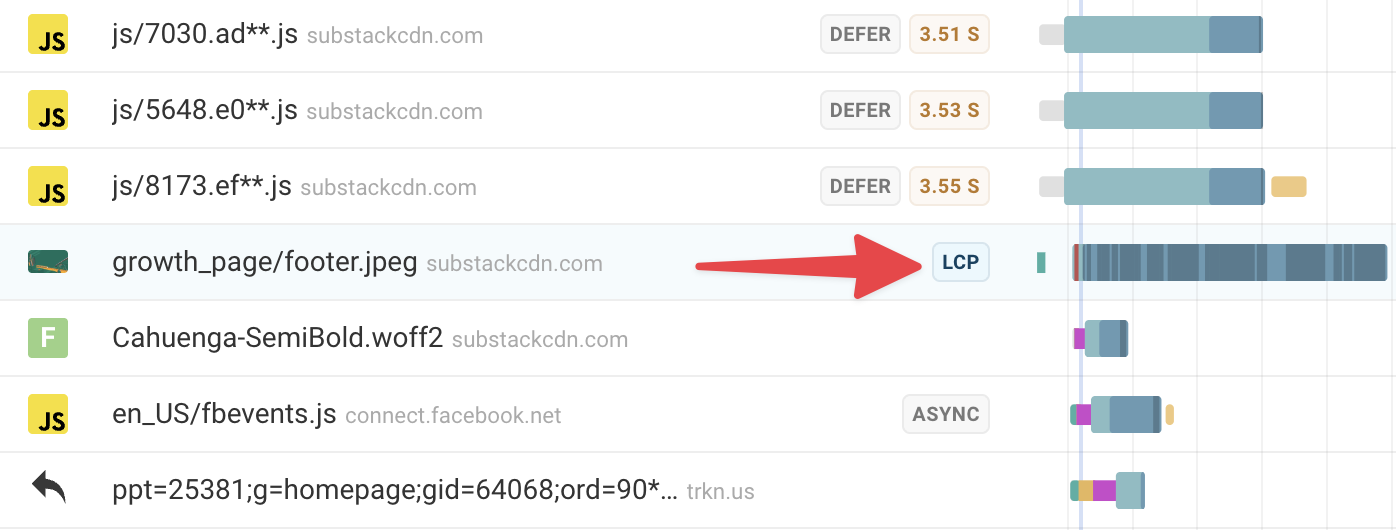
On the right, the LCP image is 1.95 MB in size, which is huge. Downloading the file shows that it's a 4096x2377 JPG, unnecessarily large for nearly all users, except the few using large 4K desktop monitors. (A separate mobile speed test confirms that the image is always downloaded at full resolution, regardless of the user's actual screen size.) So there's a big opportunity to:
- Provide width-based responsive images depending on the size of the user's browser window
- Use AVIF, WebP, or other image compression tools to bring the file size down
Next, check the request initiator. It tells you which resource caused the browser to discover the image, and whether the image could have been discovered earlier.
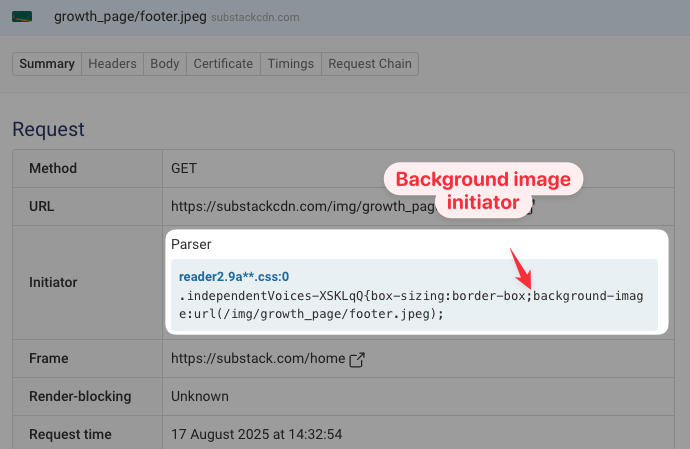
In this case the request initiator is a CSS file, setting the image using the background-image CSS property for a <div>, rather than an <img> element. That means the image is not referenced directly in the HTML file.
We can click Request Chain to visualize this:
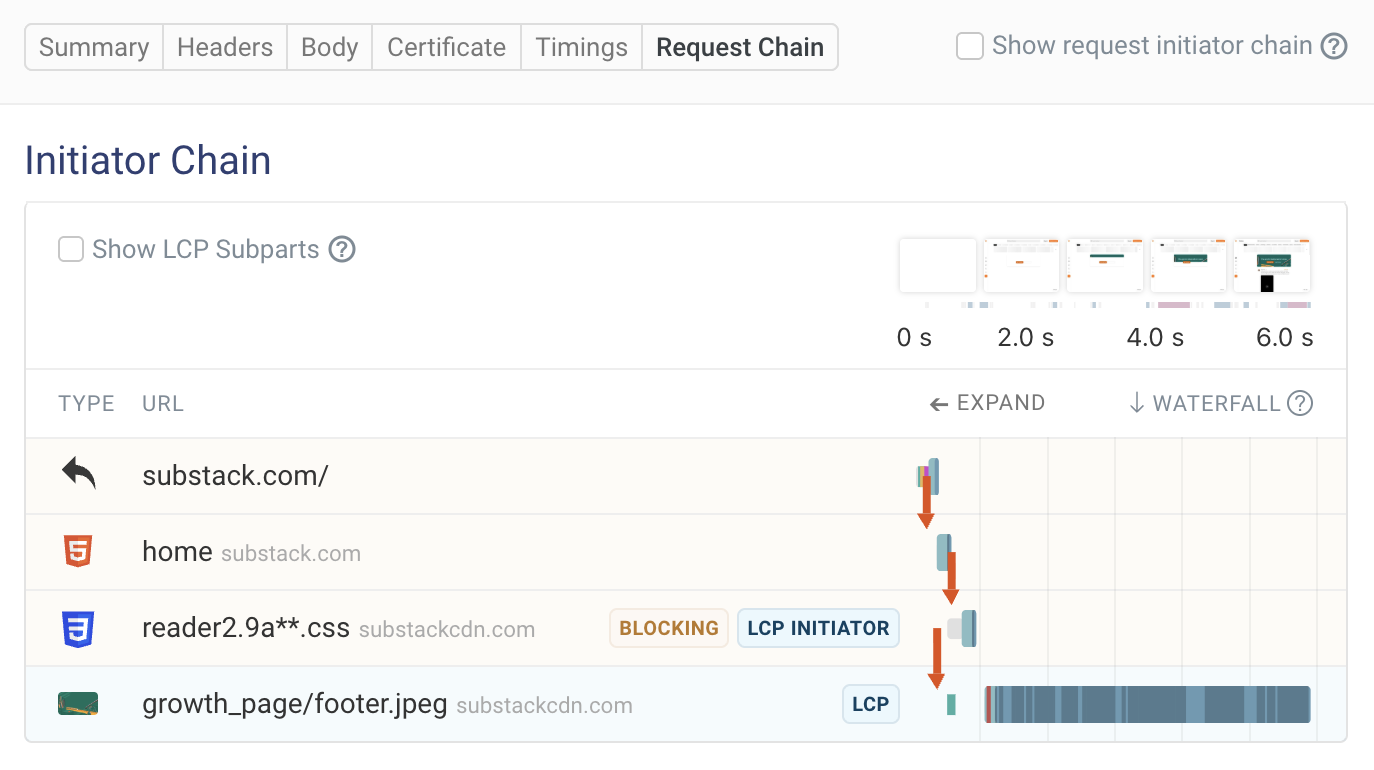
The browser must discover and download the CSS file before it even knows about the LCP image, costing some valuable time. Instead, we could preload the LCP image in the HTML file itself.
Next, check which domain serves the image. If the image comes from a different origin than the document, the browser needs to open a new connection before the download can start.

The document is loaded from substack.com, but the image is loaded from substackcdn.com. That means a new server connection is needed for the first request on the substackcdn.com domain. In many cases, it would help to host the image on the same domain as the HTML file (substack.com) to speed things along.
In this case, though, that isn't the bottleneck. The browser already established the connection to substackcdn.com when it downloaded the initiating CSS, and Substack has also wisely set up a preconnect to that domain as a resource hint.
Finally, check the request priority. Ideally the browser treats the LCP image as high priority from the moment it discovers it.
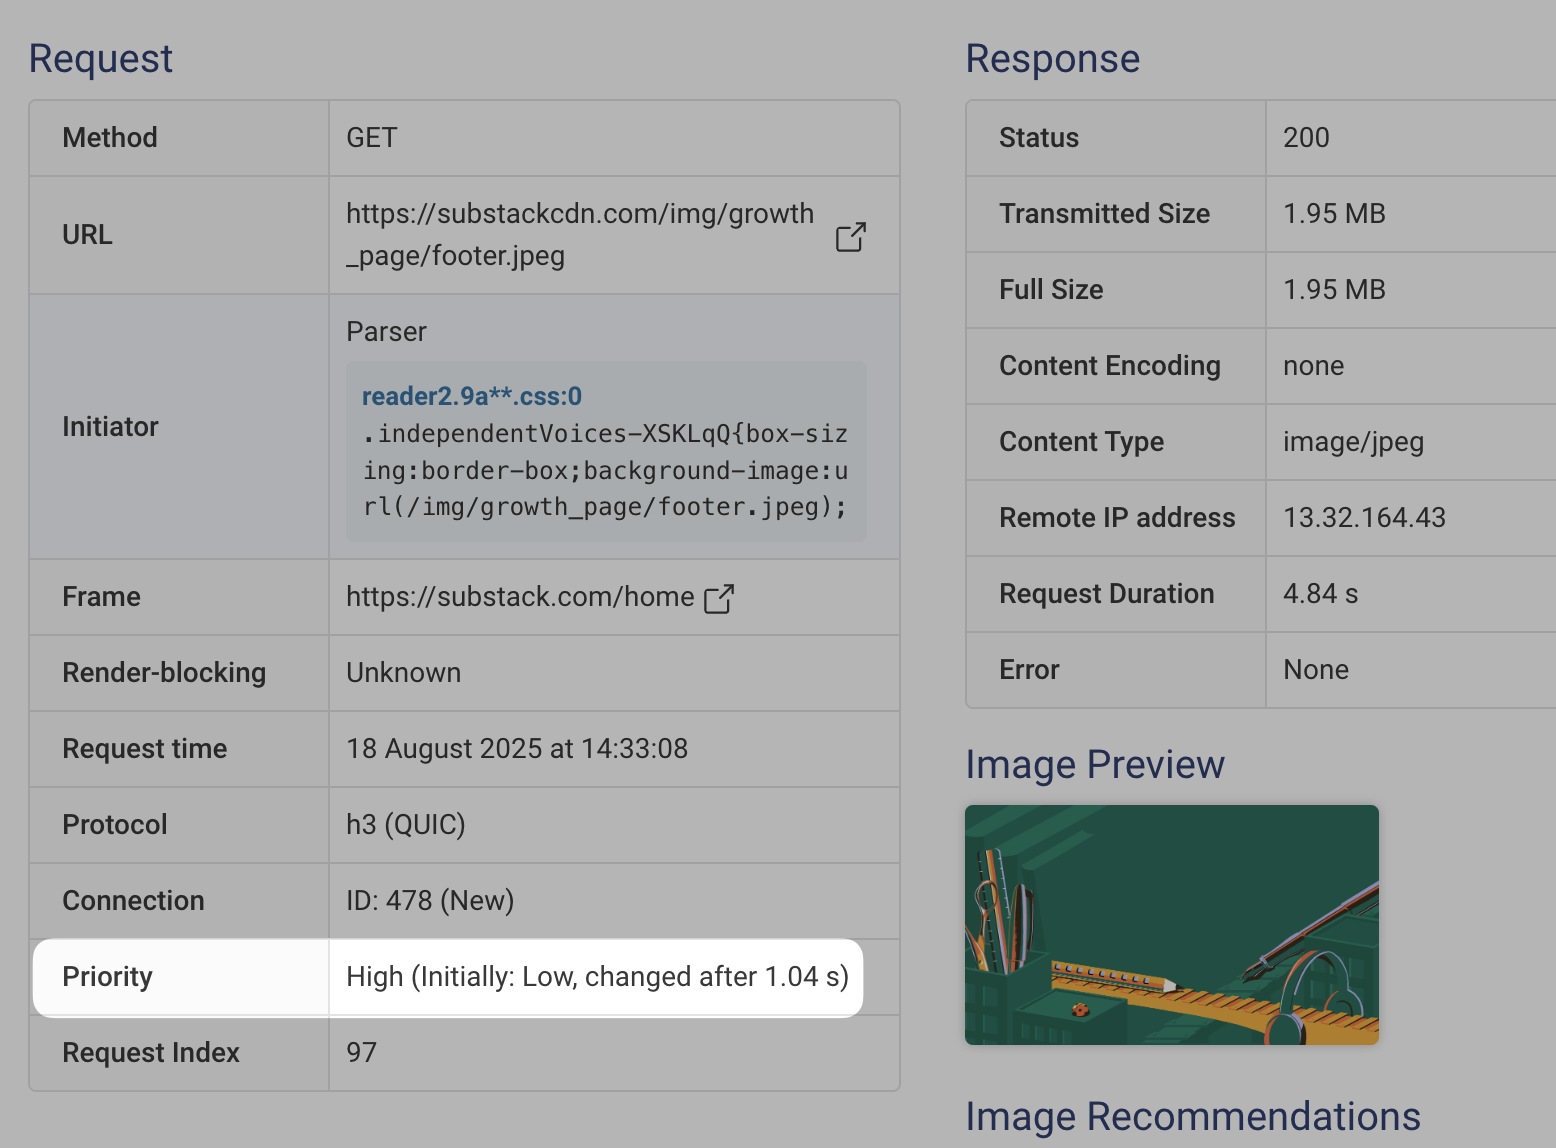
Eventually it was, but not at first. It takes over a second for the browser to realize that this image should be downloaded as a priority.
Adding a fetchpriority="high" attribute to a preload resource hint would help increase the priority of the image request.
Currently, the browser is downloading over 150 other resources, some of them quite large, alongside the LCP. This further delays the transfer of the already-hefty image file.
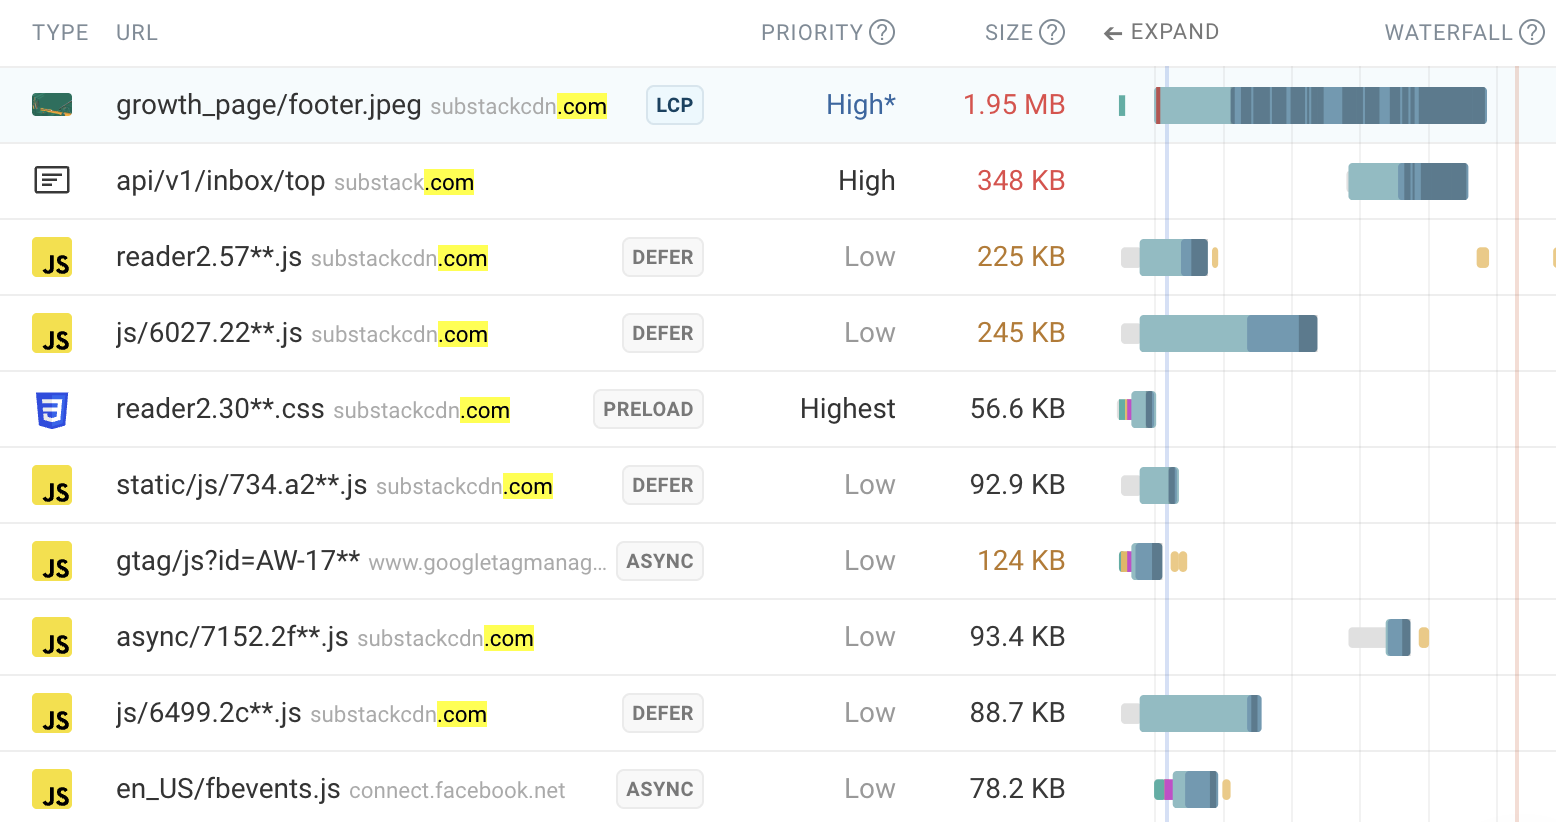
Chrome is not allocating bandwidth to this resource first, whereas prioritizing the LCP image instead could help optimize the LCP score for this page.
Consider using responsive images
Responsive images let you load appropriately sized images for the context where the image elements appear.
For example, on a mobile device with a low-resolution screen you might only need a small image. Loading small images saves bandwidth and means that the image files will download more quickly.
In contrast, on a high-resolution desktop screen you might need to load a larger image to deliver the best visual results to visitors.
Don't lazy load the LCP image
Lazy loading can speed up your website by focusing bandwidth on high-priority resources. However, when lazy loading is used on LCP elements it can actually make your site slower, as these images should be loaded with a high priority.
Google found that websites with image lazy loading enabled tend to have a higher LCP. So be careful not to use loading="lazy" incorrectly.

Prioritize the LCP image
Even if you're not lazy loading the LCP image, the browser still assumes that most images on a page are low priority. For example, they might only appear below the fold or in the page footer.
The browser cannot identify important above-the-fold images until after the initial render of the page, when all relevant styles have been loaded. Therefore a low resource priority is assigned initially until after the First Contentful Paint when the page layout is known.
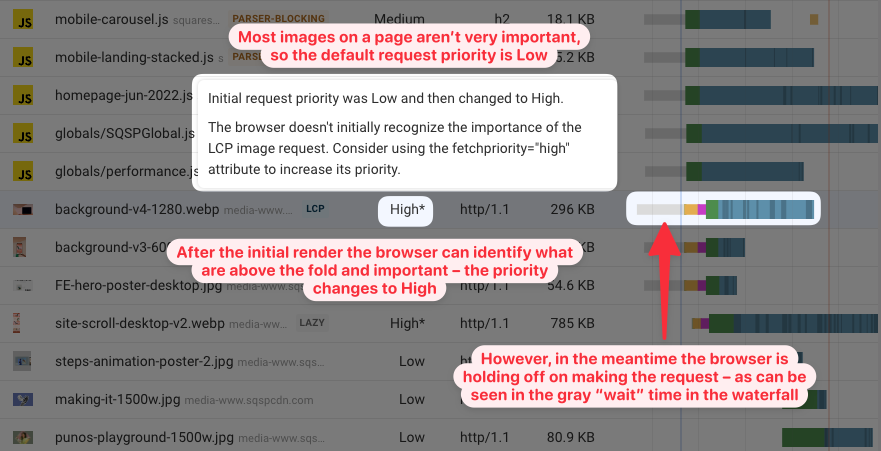
You can use the fetchpriority="high" priority hint to tell the browser that a specific image request is important. By defining a fetch priority in the initial page HTML, the browser can make a high-priority request for the image right away without waiting for the page to start rendering.
If the LCP image is a CSS background image you can add a preload tag to HTML:
<link rel="preload" href="/images/photo.jpg" as="image" fetchpriority="high" />
Normally background images are assumed to be low priority content that's purely decorative. The preload hint lets you tell the browser that this resource is actually important.
You should not overuse fetchpriority="high" as doing so can make your web performance worse.
LCP image request chains
Ideally, only two requests should be needed to load an LCP image:
- Load the HTML document
- Load the LCP image referenced in the document
But sometimes additional requests are part of the LCP request chain.
This waterfall shows a page that first loads and runs lazyload.min.js before starting to download the LCP image. Instead of being initiated by the HTML, the LCP request is triggered by the JavaScript library.
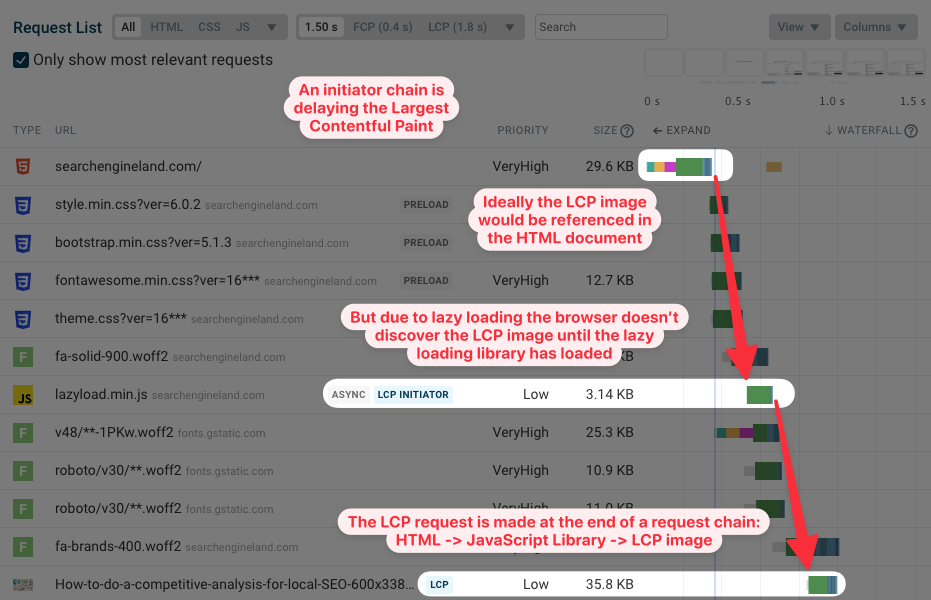
If you use JavaScript to lazy load the LCP image, disable lazy loading for the LCP image entirely. Reserve lazy loading for images below the fold.
Client-side applications can also cause request chains that include JavaScript files. Ideally, you should implement server-side rendering for your JS app, or otherwise optimize the client-side code by reducing bundle size or loading JSON data earlier.
To view requests that are involved in loading the Largest Contentful Paint image, you can run a DebugBear speed test and expand the Largest Contentful Paint metric. You'll then see a list of requests involved in loading the LCP image.

Ideally you don't want more than 2 requests involved in loading the LCP image: the HTML document, and the image itself.
Be careful with progressive JPEGs
Progressive JPEGs can speed up your website by quickly showing a low-quality image and then loading the full-size version later on.
Unfortunately, the browser only records the Largest Contentful Paint once the image has fully downloaded. In the filmstrip below it looks like the LCP element has rendered after 3.5 seconds, but actually the full-size version of the image only loads after 6.3 seconds.

Progressive JPEGs aren't larger than non-progressive files of the same quality. But to improve Core Web Vitals you still need to optimize the overall JPEG size even if the user experience is great already.
If the LCP element is a heading or paragraph
Ideally the text of the LCP element is included in the page HTML. Then it should show up as soon as all render-blocking resources are loaded.
However, there are a few reasons why text might only render later. We'll discuss a few here, but we also have an in-depth guide to optimizing LCP for H1 headings and other text elements.
Web fonts take a while to load
Here's an example where the Largest Contentful Paint doesn't happen until fonts are loaded. Using font-display: swap can prevent this.

You can host fonts on your own website instead of with a third-party to make them load more quickly. This way no additional web server connection is required.
Don't inline fonts in your CSS or HTML as this will likely cause your website to start rendering more slowly. However, you can inline the CSS font definitions themselves.
Text is inserted using JavaScript
This request waterfall is from a typical single-page app. After loading the document, the page loads several JavaScript files, then loads the data it wants to display, and then finally spends a bunch of CPU time rendering the page. Only then does the LCP content appear.
The ideal solution here is server-side rendering. If that's not an option, make sure your app bundles load in parallel, and work on reducing their download size.

Optimizing LCP with a Content Delivery Network (CDN)
Content Delivery Networks can help you serve content more quickly to your visitors. Visitors connect to CDN servers that are distributed across the world, meaning server connections can be established more quickly.
CDNs also provide caching, text compression, and automatic image optimization. These features all help your website load faster and improve your LCP.
If the LCP element is a video
HTML video elements can also be responsible for the LCP. For videos, the LCP is recorded either when the first frame is displayed or when the poster image is loaded.
Adding a poster image and adding a preload link tag with the fetchpriority="high" attribute is a good way to improve video LCP.
Chrome does not currently support preloading video files.
If JavaScript re-renders the page
If JavaScript kicks in after the initial page load and re-renders the page, the LCP element can be updated.
DebugBear allows you to look at how LCP develops as the page loads. DebugBear shows a new record every time a larger content element is displayed.
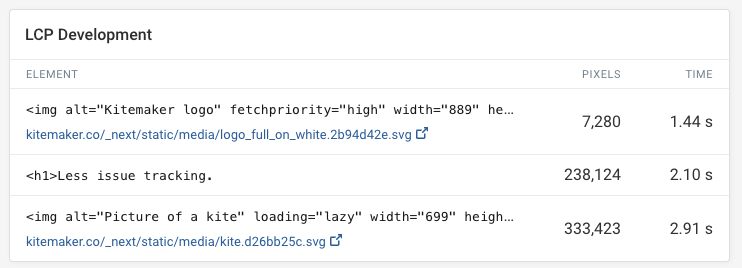
For example, if the initial page load happens through server-side rendering but then a JavaScript framework hydrates the page and re-renders the content, you should make sure the LCP element is not changed. If a change can't be avoided, make sure the new LCP element is not larger than the original LCP element.
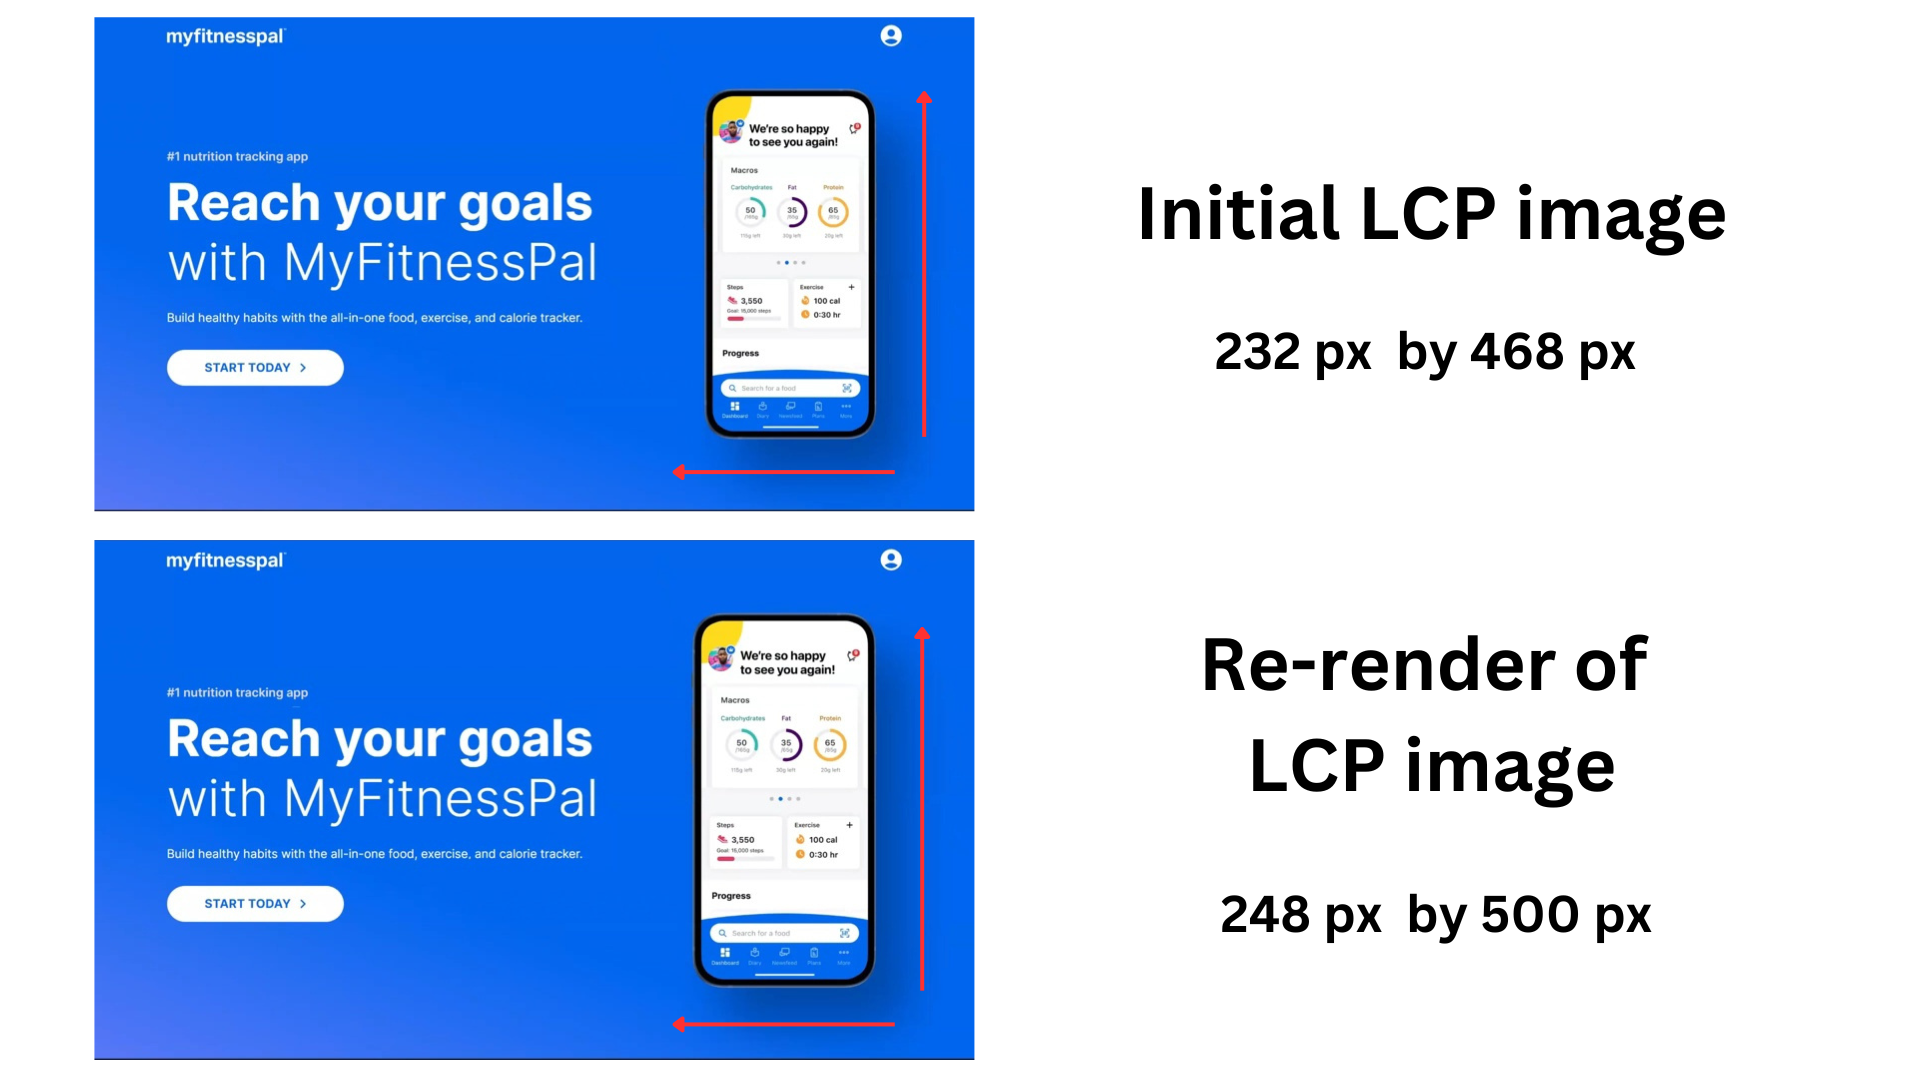
Here's an example of a page where client-side rendering results in a larger LCP element than the server-side rendered version. As a result, a new LCP milestone is recorded after hydration is complete, even though visually very little changes.
Prerender subsequent pages for instant loading
You can prerender subsequent pages in a user journey to make them load instantly. Doing so can provide a near-instant LCP for users who click on a link to another page on your website. Consider using Speculation Rules to predict which pages users are likely to visit next, and prerender them.
How does Largest Contentful Paint affect Lighthouse scores?
Largest Contentful Paint determines 25% of the overall Lighthouse Performance score.
This table shows the maximum LCP you'd need to achieve a certain Largest Contentful Paint score.
| LCP subscore | Max LCP (Mobile) | Max LCP (Desktop) |
|---|---|---|
| 100 | 1.5s | 0.6s |
| 90 | 2.5s | 1.2s |
| 50 | 4.0s | 2.4s |
| 10 | 6.5s | 4.9s |
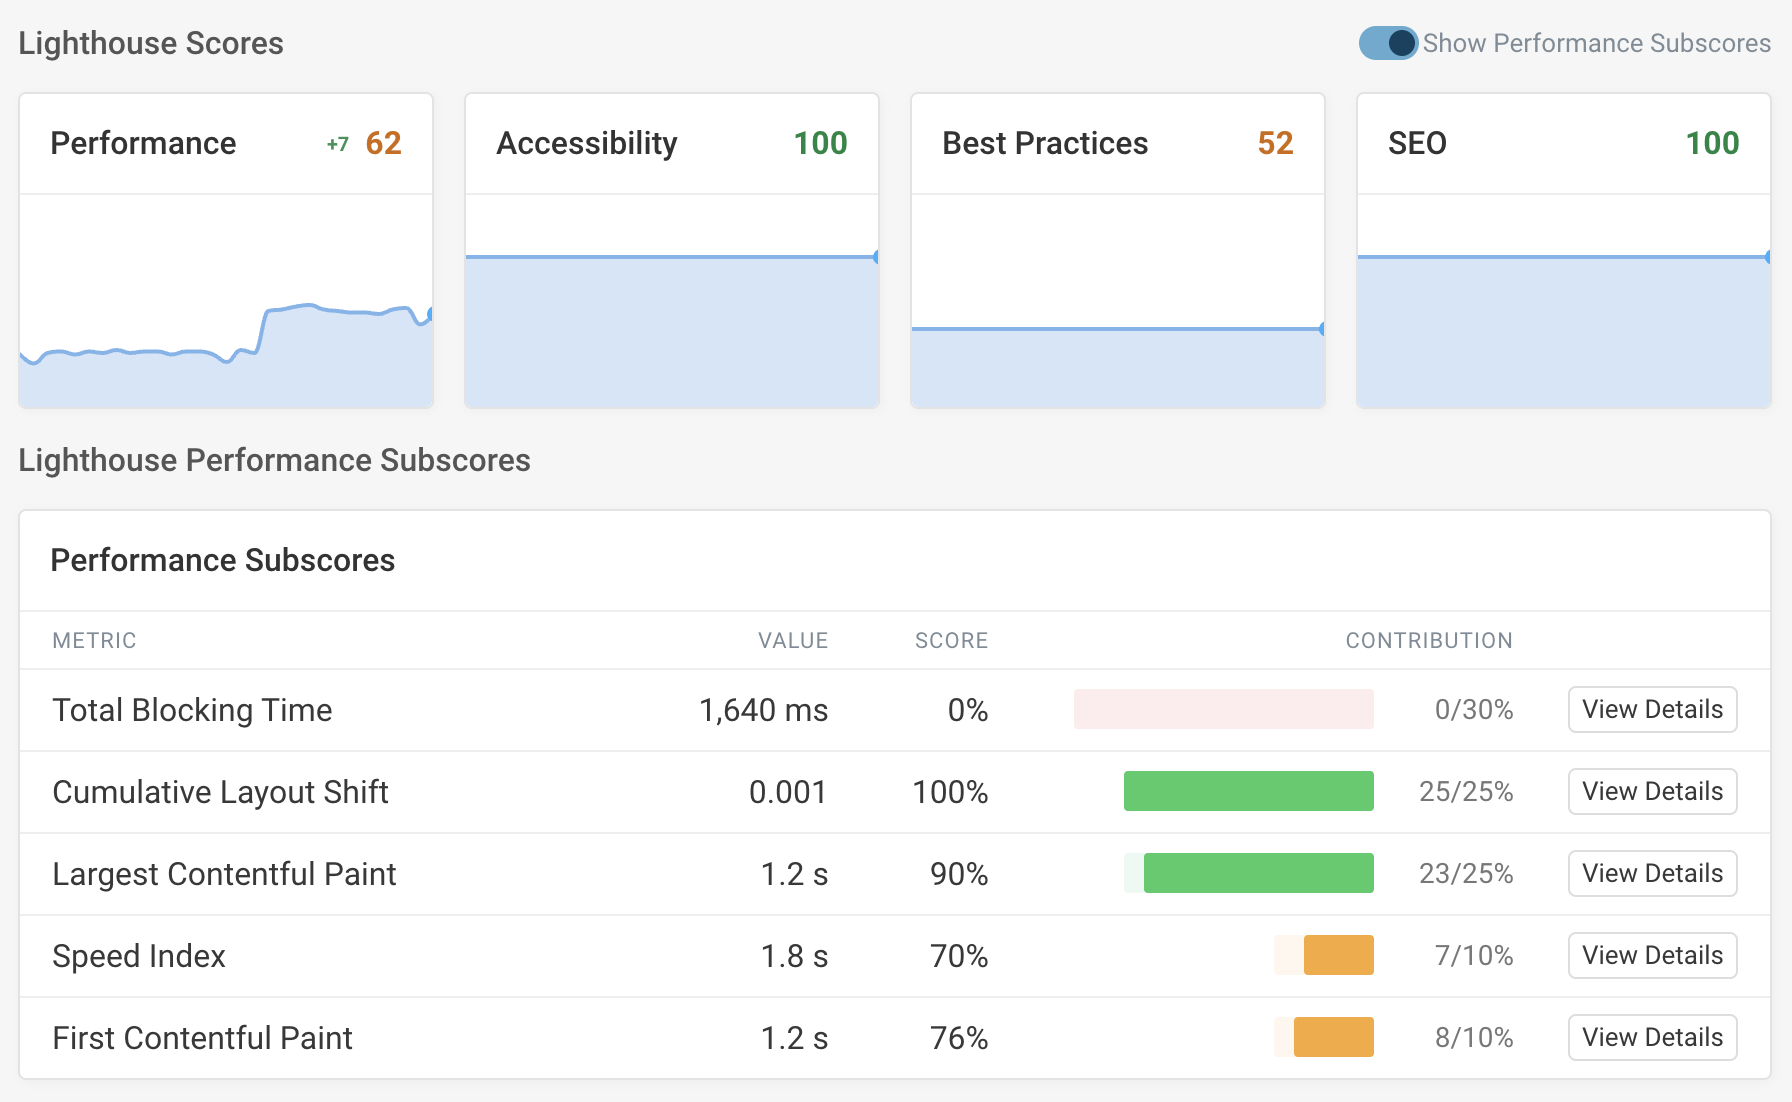
The Lighthouse tab in the DebugBear speed test result can show you the performance subscores for LCP and other contributing metrics. Here we can see that the LCP has a good score of 90%, contributing 23 points to the overall Lighthouse performance score.
However, the Total Blocking Time metric is poor, which means this page misses out on 30 points because of this metric.
Measuring LCP sub-parts
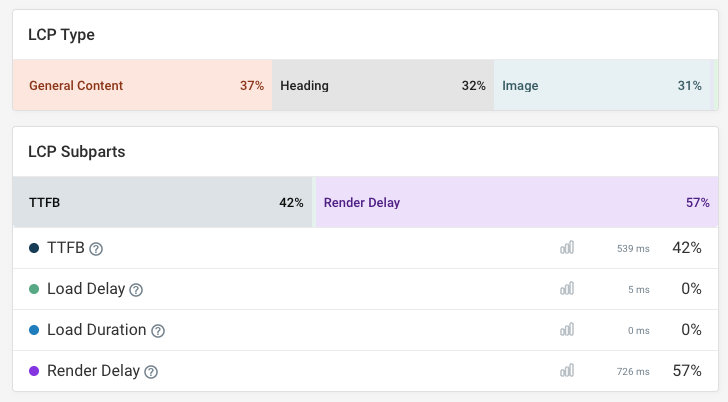
The overall Largest Contentful Paint metric can be divided into four LCP sub-parts to make it easier to optimize:
- Time to First Byte: server response time for the HTML document
- LCP Resource Load Delay: time until the browser discovers the LCP image
- LCP Resource Load Duration: time spent loading the LCP image
- LCP Render Delay: delay before the LCP image or text element becomes visible
You can find these numbers in Lighthouse or in the DebugBear real user monitoring data.
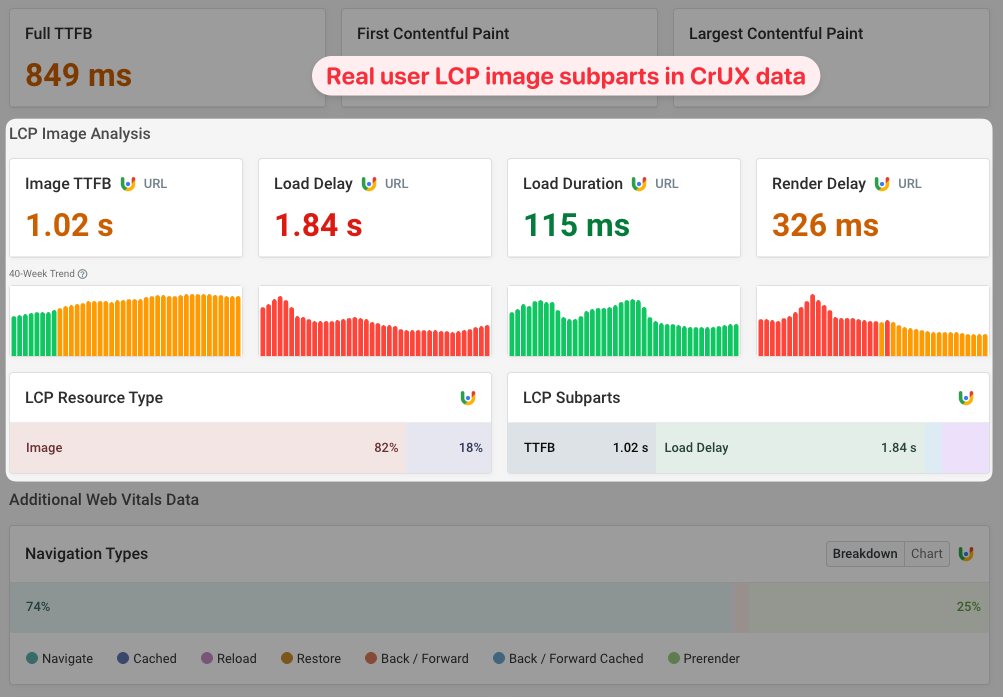
Google also provides real-user LCP component data as part of the Chrome User Experience Report. This is real-world data that Google publishes based on Chrome users that have opted into sharing their performance data with Google.
To view these metrics, open the Web Vitals tab of the DebugBear page speed test and scroll down to the LCP image analysis section.
Largest Contentful Paint definition
What does Largest Contentful Paint mean? The exact definition changes over time as browsers try to make the metric more useful as well as standardizing behavior across different browsers.
Changes to the LCP definition
Different versions of Chrome measure LCP slightly differently. Google keeps track of changes to the LCP definition here.
These changes aim to reduce cases where the LCP is identified incorrectly, resulting in a metric value that does not match the real user experience.
For example, full-viewport background images used to count as LCP candidates, even though they are usually decorative rather than the main page content. Chrome now ignores them, which is why they're excluded from the list of eligible elements above.
When is the LCP value final?
The Largest Contentful Paint can update later on in the page load process, if a large part of the UI is updated.
For example, the LCP might update if:
- a low-resolution image is replaced with a high-resolution one
- a slider advances to the next slide
- parallax is enabled on a background image
Once the user starts interacting with a page, by clicking, tapping, scrolling, or pressing a key, the LCP value no longer updates.
Largest Contentful Paint and Iframes
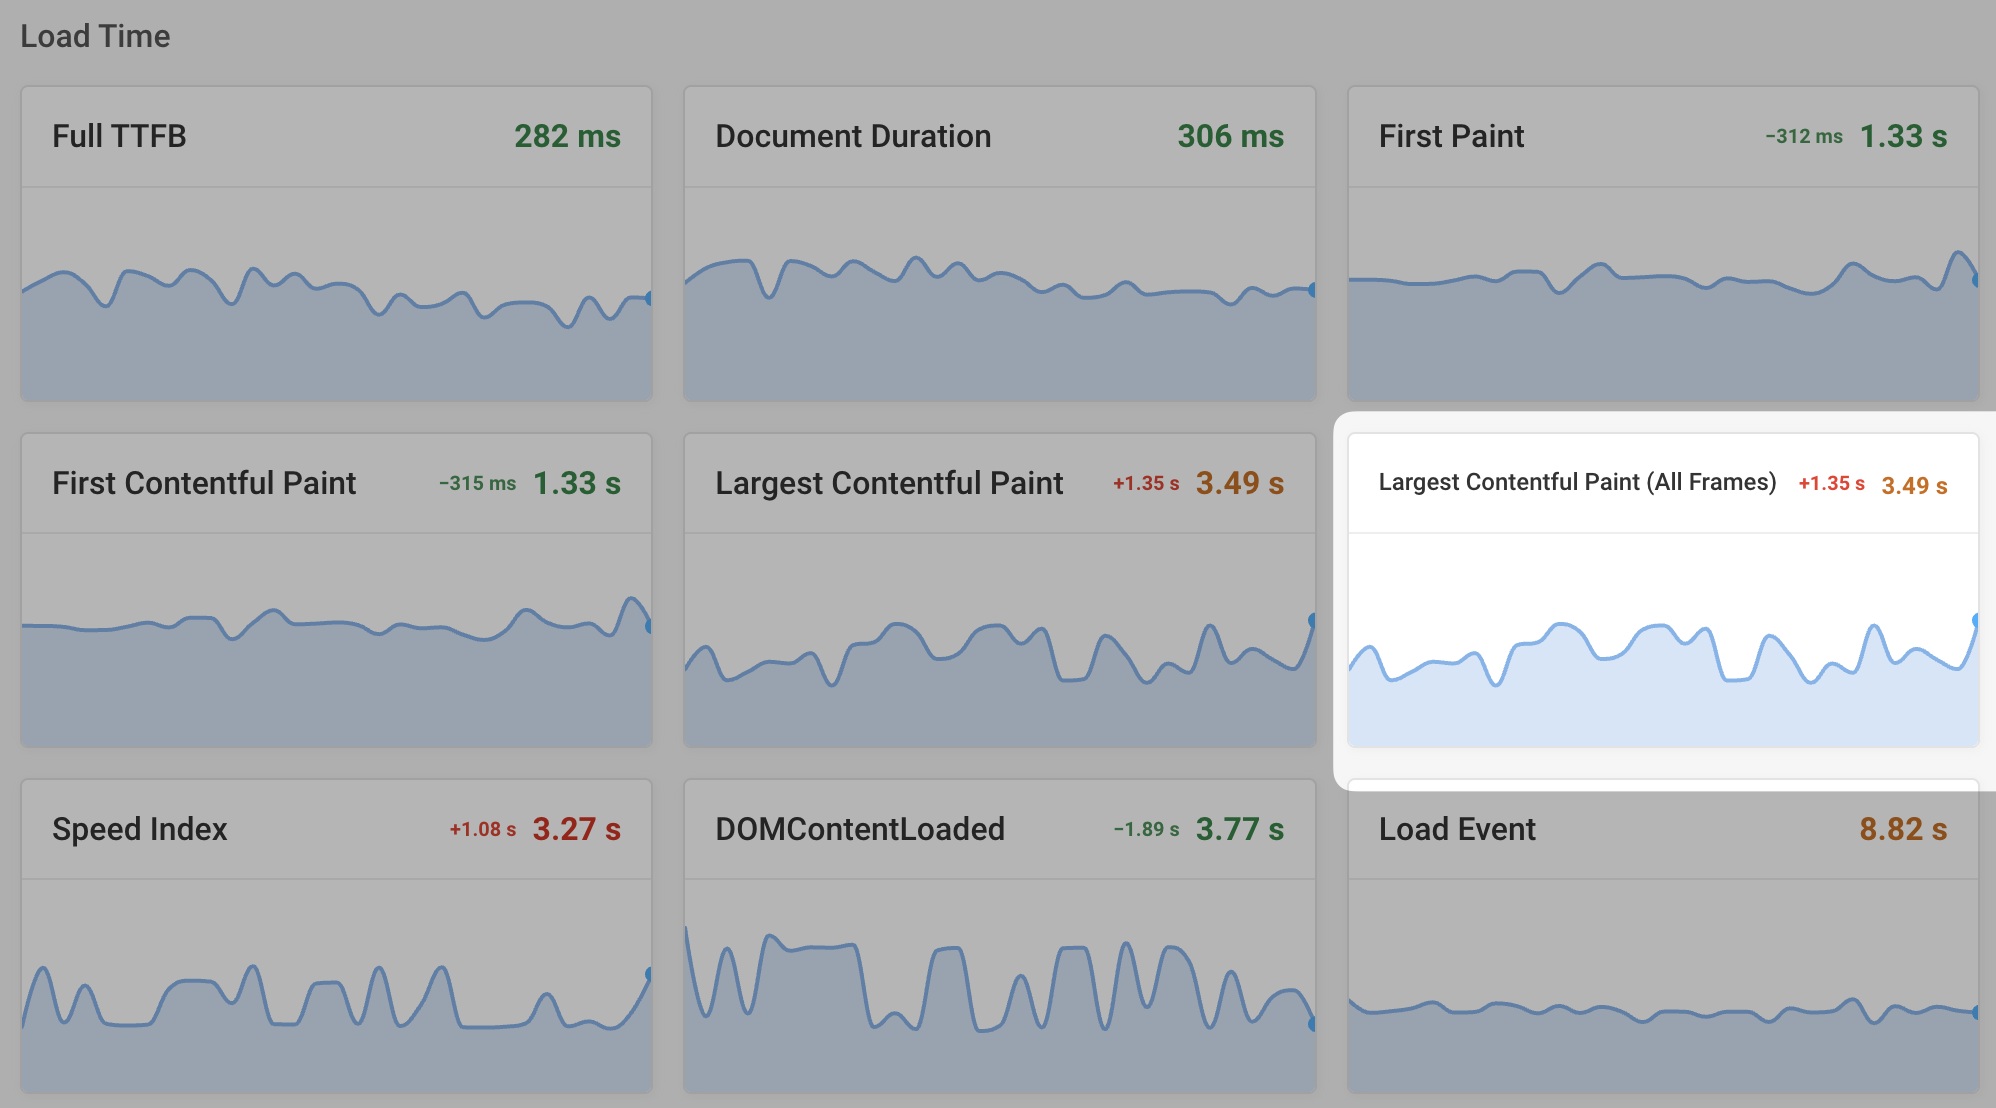
By default, lab testing tools like Lighthouse only show the LCP score for the main frame. However, for real-user data in the Chrome User Experience Report (CrUX), subframes created with the <iframe> tag can also impact LCP.
In a DebugBear page speed test result you can find the LCP (All Frames) score in the Metrics tab.
LCP in single-page applications
By default, single-page applications only report a Largest Contentful Paint score for the initial page load.
Chrome 151 added support for measuring Core Web Vitals for subsequent soft navigations, so each in-app page can report its own LCP score. Safari and Firefox don't support this, so the data only covers your Chromium visitors.
You can enable this in DebugBear with SPA mode. Keep in mind that Google's CrUX data still only reports LCP for the initial page load, so these scores won't match what you see in Search Console.
What browsers support the Largest Contentful Paint metric?
The Largest Contentful Paint metric is supported in all major browsers, including Chrome, Edge, Firefox, and Safari.
However, this has only been the case since late 2025. You may still see visitors using browsers that don't support the LCP metric.
Monitor Largest Contentful Paint
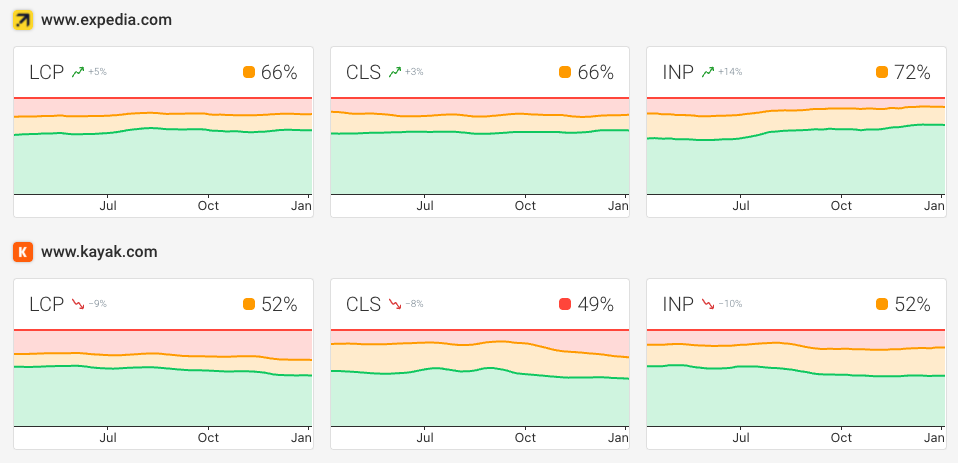
DebugBear can monitor the Largest Contentful Paint and other Core Web Vitals of your website. Run continuous Lighthouse-based tests, check Google's CrUX dataset daily, and collect real user analytics on your website.
The project dashboard shows you how LCP and other metrics have changed over time. On top of page load time you can also track page weight, layout stability, CPU time, and custom user timing metrics.
Use the comparison view to see which of your pages are getting faster or slower.

Click through to each specific page to see how scores have changed over time, debug poor page speed, and compare test results to each other to identify what caused a performance regression.
Our rendering filmstrip highlights the Largest Contentful Paint milestone and puts it into context with the overall page load process and other page speed metrics.

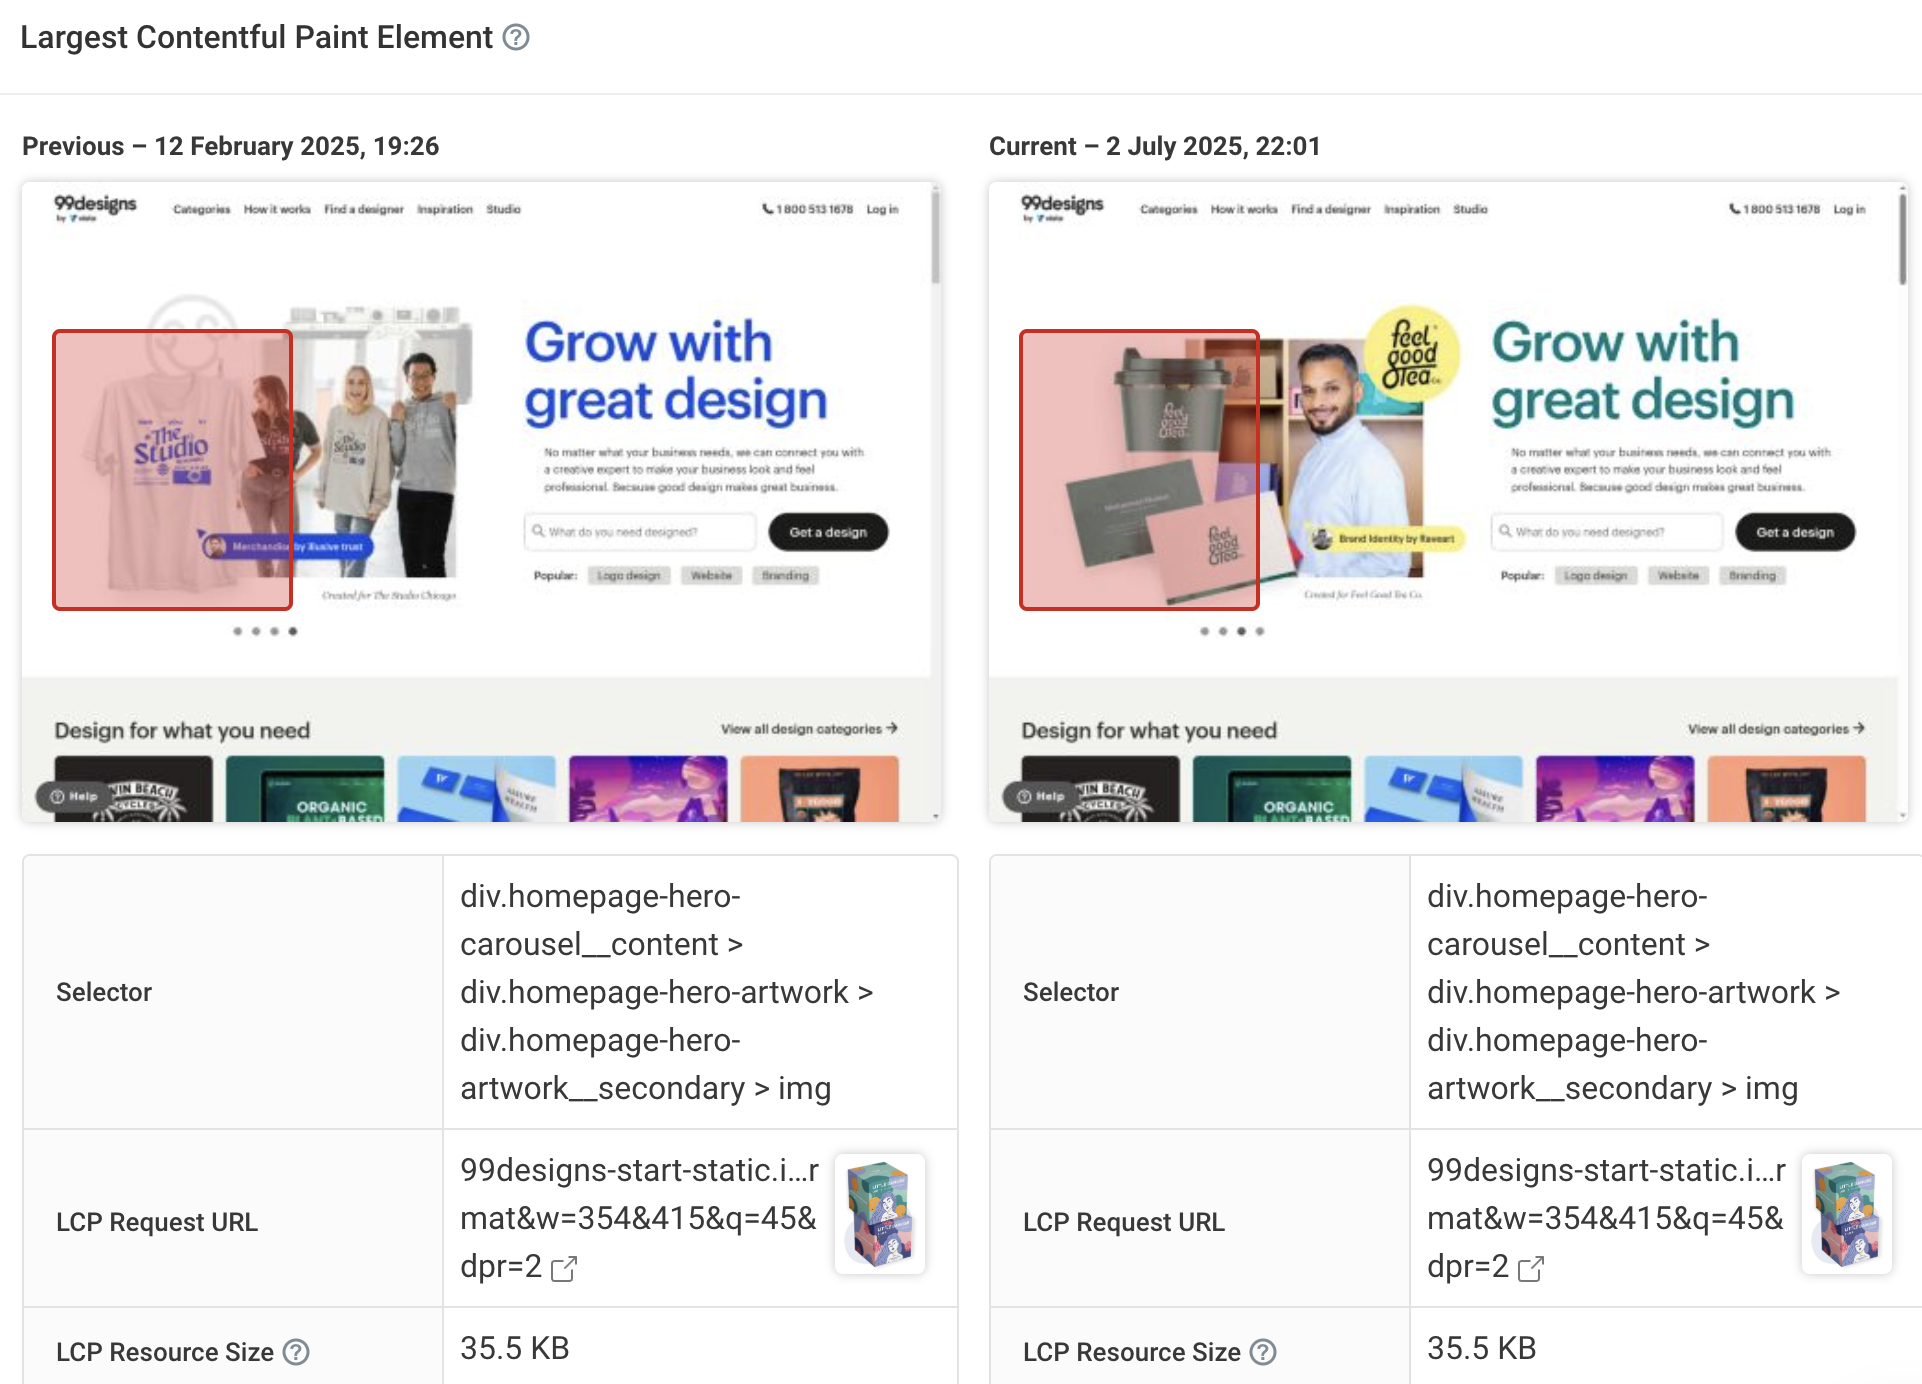
You can also see what the Largest Contentful Paint element is and if it has changed, potentially impacting your performance score. In the screenshot preview it's highlighted with a red border.
For images you can also see:
- The image URL
- The file size
- The download duration
- The request priority
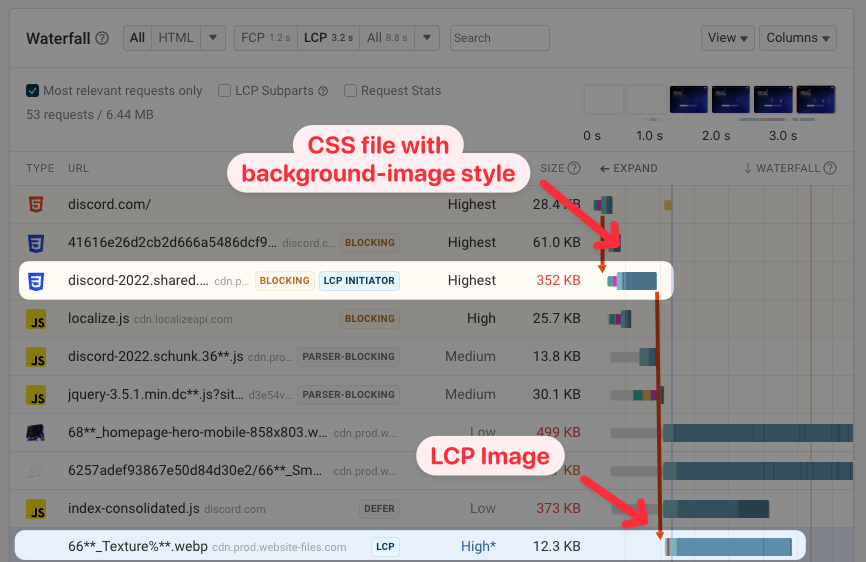
Our detailed request waterfall highlights the LCP image request with the LCP badge. If the image was not directly referenced in the HTML code you can also see the full chain of requests that triggered the LCP image download.
Select the LCP view filter to focus the waterfall on just the early requests when loading the page.
Use the CrUX dashboard to benchmark website performance in your industry.
This way you can see how user experience on your website compares to competitors and if it could be impacting your relative ranking in Google search results.
Real user monitoring insights for Largest Contentful Paint
In addition to setting up scheduled tests, you can also use DebugBear to monitor real user experiences on your website. This gives you a better insight into how different visitors experience your website across all three Core Web Vitals.
Real user monitoring data can tell you what pages on your website are slow for actual visitors, diagnose regional differences in user experience, and alert you to any performance regressions.
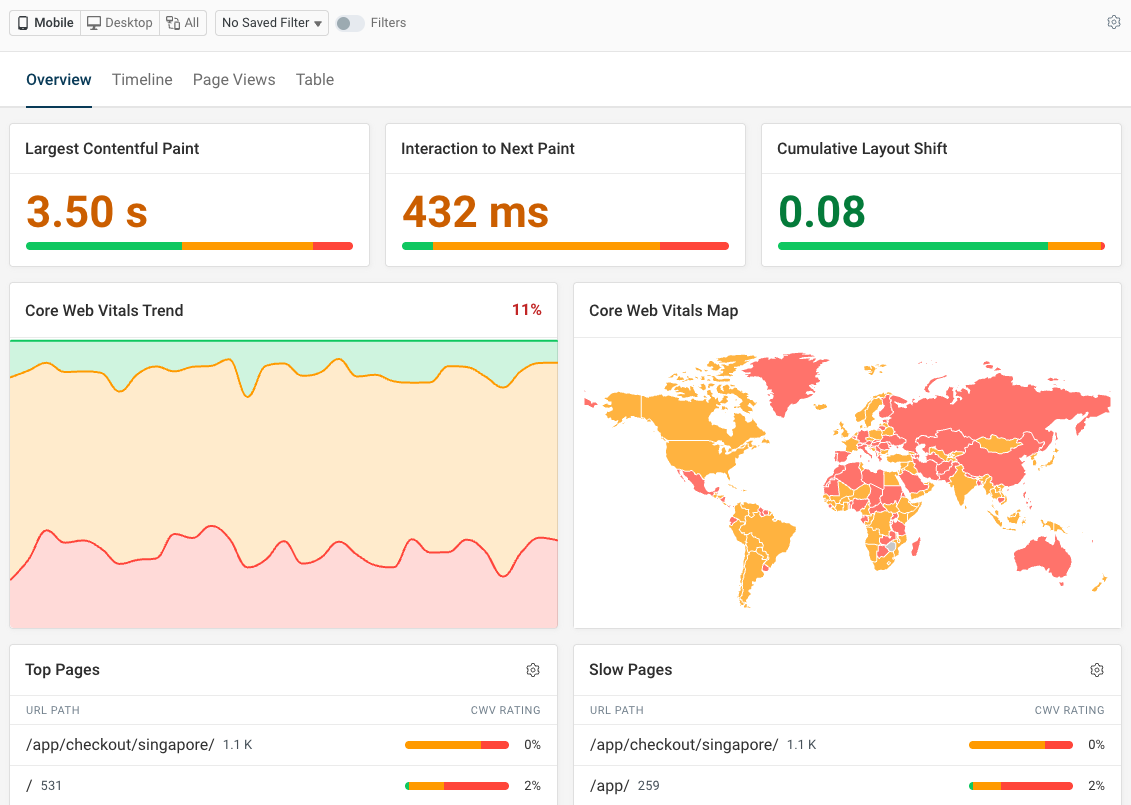
It also shows what's causing delays for different user segments.
For example, DebugBear highlights what type of LCP element is slow, how image load is delayed, and whether specific scripts require slow CPU processing that's delaying the page load.
Sign up for a free trial to improve your Largest Contentful Paint scores and get comprehensive web performance insights for your website.

Monitor Page Speed & Core Web Vitals
DebugBear monitoring includes:
- In-depth Page Speed Reports
- Automated Recommendations
- Real User Analytics Data