
Single page applications (SPA) don’t download a new HTML document when a visitor moves from one page to the next. They rely on soft navigations instead, and those are far harder for the browser to detect than hard navigations.
For years that meant Core Web Vitals and other web performance metrics only really described the initial page load of a single page app. Whatever a visitor did after that was either attributed to the URL they originally opened or not measured at all.
That has changed. Chrome 151, released in August 2026, can measure Core Web Vitals for soft navigations, the result of several years of work by the Chrome team on defining the heuristics and creating the APIs.
That changes what your metrics describe. A score that used to summarize a whole session now describes a single page inside your app, which affects how we build, monitor, and optimize single page applications.
In this article, we’ll look into how navigation works in single page applications, what exactly qualifies as a soft navigation, how each Web Vital behaves once one is detected, and how to collect this data for your own site.
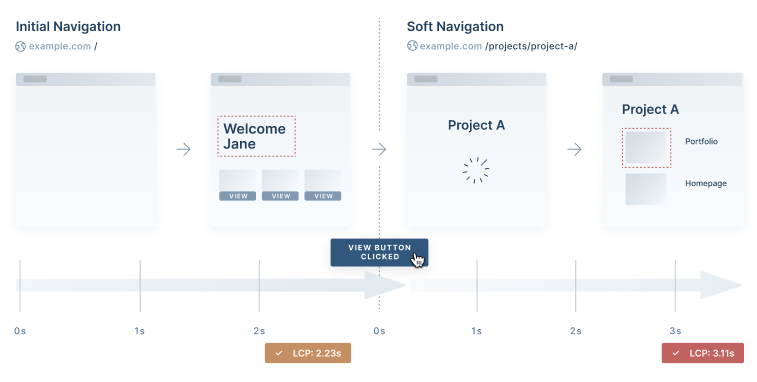
A Brief Recap of How SPAs Work
Single page applications provide an alternative web application architecture to websites and multi page applications (MPAs). They are typically created with component-based JavaScript frameworks such as React, Vue, Angular, and others.
As opposed to traditional websites and MPAs which download a new HTML page whenever the user performs an action (e.g. clicks a button or menu item), SPAs only download a single HTML page (this is where the name ‘Single Page Application’ comes from), then update the page content using JavaScript every time the user interacts with the app.
While the SPA architecture provides users with a more dynamic interface and can react to user actions faster than a traditional website, it’s hard to track in-app navigation in a single page application because, by default, the browser renders every piece of content (including partial and full page rewrites) under the same top-level URL.
As a result, early SPAs had various usability and SEO issues. For example, content changes were not followed by corresponding URL changes in the browser’s address bar, and search engine, social media, and other bots couldn’t index dynamic page content properly.
SPA developers solved these issues by introducing the concept of ‘soft navigations’, which maps ‘soft URLs’ to dynamically rendered pages. They are called ‘soft’ because the browser doesn’t download a new HTML file in the background when the app generates a dynamic URL for the updated page content.
What Is a Soft Navigation?
A soft navigation is essentially the dynamic emulation of the corresponding hard navigation that would be used in a website or multi page application.
To expose dynamic content changes to the web browser and other user agents, SPAs update the URLs dynamically and push the previous URLs into the browser’s history using the History API.
As a result, on the surface, the updated page content will behave like a new HTML page — e.g. users will be able to see a new URL in the browser’s address bar, bookmark the page, share it on social media, use the browser’s Back and Forward buttons, etc.
Hard Navigation vs Soft Navigation: A Code Example
Now let’s see a code example of the technical differences between soft and hard navigations.
An Example of Hard Navigations
In the code snippet below, the three links in the <header> section are hard navigations and could be used on a static HTML page:
<!-- Hard navigation with HTML -->
<!-- index.html -->

<header>
  <a href="/">Home</a>
  <a href="/about">About</a>
  <a href="/contact">Contact</a>
</header>
To allow the user to navigate this website, we would also need to create an about.html and a contact.html file and upload them to the server.
The Corresponding Soft Navigations (in React)
Now, let’s see what the corresponding soft navigations look like in a single page application created with the React framework:
/**
 * Soft navigations with React
 * components/Header.js
 */
import { Link } from "react-router-dom";

const Header = () => {
  return (
    <header>
      <Link to="/">Home</Link>
      <Link to="/about">About</Link>
      <Link to="/contact">Contact</Link>
    </header>
  );
};

export default Header;
And, here's the respective App.js file:
/**
 * Soft navigations with React
 * App.js
 */

import {
  BrowserRouter,
  Route,
  Routes,
} from "react-router-dom";
import Header from "./components/Header";
import Home from "./components/Home";
import About from "./components/About";
import Contact from "./components/Contact";

function App() {
  return (
    <BrowserRouter>
      <div className="container">
        <Header />
        <Routes>
          <Route path="/" element={<Home />} />
          <Route path="/about" element={<About />} />
          <Route path="/contact" element={<Contact />} />
        </Routes>
      </div>
    </BrowserRouter>
  );
}

export default App;
To allow the user to navigate the React app above, we would also need to create the Home.js, About.js, and Contact.js components and add them to the application.
All in all, the browser will compile the React code above to the same HTML as in the first code snippet above.
Under the hood, the Link element uses history.pushState to update the page URL without fully reloading the page.
However, there’s an important difference:
Now, the three links in the <header> section are soft navigations.
When the user clicks one of them, the browser will update the page content and URL on the fly using JavaScript instead of sending an HTTP request to the server and downloading a new HTML page.
The React app will respond faster than the traditional HTML website because the entire code is already downloaded, the JavaScript is compiled, and no more client-server communication is needed.
However, capturing web performance metrics for a dynamic update of a single HTML page (i.e. soft navigation) is not as straightforward as measuring the performance impact of a static URL change where a real HTML page load takes place (i.e. hard navigation).
The Challenges of Reporting Soft Navigations
The issue with soft navigation reporting is that each SPA framework (or application in the case of native ECMAScript components) defines soft navigations in a different way.
If there’s just a single HTML page, which page updates qualify as ‘navigation’? There’s no standardized answer to this question.
For example, different SPAs can:
- update the URL on different types of content changes
- load content synchronously or asynchronously
- update the URL before or after the new content loads
- preload the content or not
- … and more
However, if each SPA follows different rules to update the URL, how should website analytics tools consistently detect soft navigations and report their performance impact?
Measuring Core Web Vitals for soft navigations therefore required a definition that works for any single-page application, irrespective of the technology it was built with.
The Standardization and Implementation of Soft Navigations
Rather than trying to hook into each framework's router, Chrome detects soft navigations with a set of heuristics.
A client-side URL update is treated as a soft navigation when both of the following are true:
- A user interaction triggered the navigation
- The UI changed as a result of the navigation
Requiring these conditions keeps the count meaningful, but it also means some things you might think of as navigations don't qualify. A route change your app triggers on its own, without the visitor clicking anything, isn't counted because there's no initiating user action.
W3C Specifications and Web APIs
The Soft Navigations draft is published by W3C’s Web Platform Incubator Community Group (WICG). Incubation is where features start before they become official standards, so a shipped Chrome implementation doesn't mean the specification is finished. Details can still change based on what the implementation and real-world data reveal.
Soft navigation reporting is exposed through the Performance interface, alongside the other performance timeline entries a page can observe.
The addition of soft navigation measurement to web APIs is up to the three browser engine developers: Chromium (Blink engine), Firefox (Gecko engine), and Safari (WebKit engine). Only Chromium has implemented it, shipping in Chrome 151.
Browser Developer Tools
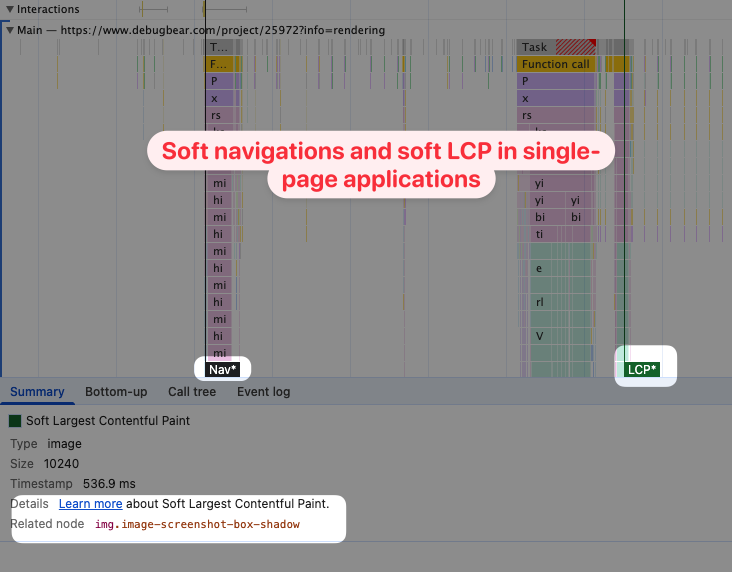
Chrome DevTools can report soft navigations and metrics like Soft Largest Contentful Paint in the Performance panel.
Soft navigation timings show up in the timeline with an asterisk, for example Nav* or LCP*:
The Web Vitals Library
The reporting itself is done in JavaScript on the page. Google’s web-vitals.js library developed its support on a separate soft-navs branch, which has since been merged into the main library. That means you can install the standard package and pass the reportSoftNavs option to the metric callbacks:
import {
  onLCP,
  onINP,
  onCLS,
} from "https://unpkg.com/web-vitals/dist/web-vitals.js?module";

onLCP(console.log, { reportSoftNavs: true });
onINP(console.log, { reportSoftNavs: true });
onCLS(console.log, { reportSoftNavs: true });
Without that option the library reports metrics for the initial page load only, which is the behavior you want if you're trying to match CrUX.
The CrUX Report
Soft navigations are still not included in the Chrome User Experience Report, which reports Core Web Vitals for hard navigations only.
That means from an SEO perspective you'll want to look at the initial page load time, while for real users keeping subsequent navigations fast is also important.
How Each Web Vital Behaves for Soft Navigations
When a soft navigation is detected, metric collection restarts for the new page. Here's what that means for each metric:
- Time To First Byte (TTFB) is always reported as 0, because TTFB is a server-side metric. When a soft navigation happens there’s no communication with the server, and the ‘first byte’ is already present in the browser.
- First Contentful Paint (FCP) was the last metric to be worked out during the experiment. The approach registered in the Chromium issue tracker is to take the timestamp of the dynamic URL change as the starting point and measure the first paint after it.
- Largest Contentful Paint (LCP) doesn’t include paints from the previous navigation, whether that was a hard or a soft one. Its value is either 0 or a positive number, the latter when the largest content element on the updated page appeared during the update.
- Cumulative Layout Shift (CLS) reports the unexpected layout shifts that have happened since the last navigation.
- Interaction to Next Paint (INP) reports the 98th percentile of all interaction delays since the previous soft or hard navigation.
The effect is that Web Vitals are split into smaller units. Instead of one score covering the entire time a visitor spent in your app, you get a score per page, separated from the initial hard navigation that downloaded the whole application code base.
Wrapping Up
In this article we looked at how soft navigations work, how Chrome decides that one has happened, and what each Web Vital measures once it does.
The comparison table below highlights the main differences between soft navigations vs. hard navigations:
| Soft navigation | Hard navigation | |
|---|---|---|
| Definition | a page update executed by JavaScript | a new HTML page download from the server |
| URL change | dynamic (the URL is updated by JavaScript, e.g. using the React Router package, the browser only ‘sees’ the top-level domain) | static (the URL is changed by HTTP, which is the result of real browser-server communication) |
| Use cases | single page applications created with component-based UI frameworks (e.g. React, Angular, Vue, etc.) or ES6 modules | websites, multi page applications |
| Speed | reacts faster to user actions | response to user actions takes at least one round-trip to the server |
| Monitoring | measurable in Chromium browsers since Chrome 151, using heuristics to detect dynamic URL changes; not supported in Safari or Firefox | easy to track and monitor |
Soft navigation reporting took several years to get from proposal to shipped browser feature, and the specification work continues now that there's an implementation to learn from. Here are some resources for following it:
- The issue tracker of WICG’s Soft Navigations repo on GitHub
- Soft Navigations Change Lists (CLs) on Chromium Gerrit
- The Chrome Origin Trial for Soft Navigation Heuristics, which is how the feature was tested on real sites ahead of the Chrome 151 release
- The Experimenting with measuring soft navigations article on the ‘Chrome for Developers’ blog by Barry Pollard and Yoav Weiss
Monitor single-page application performance
DebugBear can help you monitor single-page app performance. Our real-user monitoring product can report Core Web Vitals metrics for both traditional web apps and single-page websites, and you can choose which of the two views of your data described above you want.
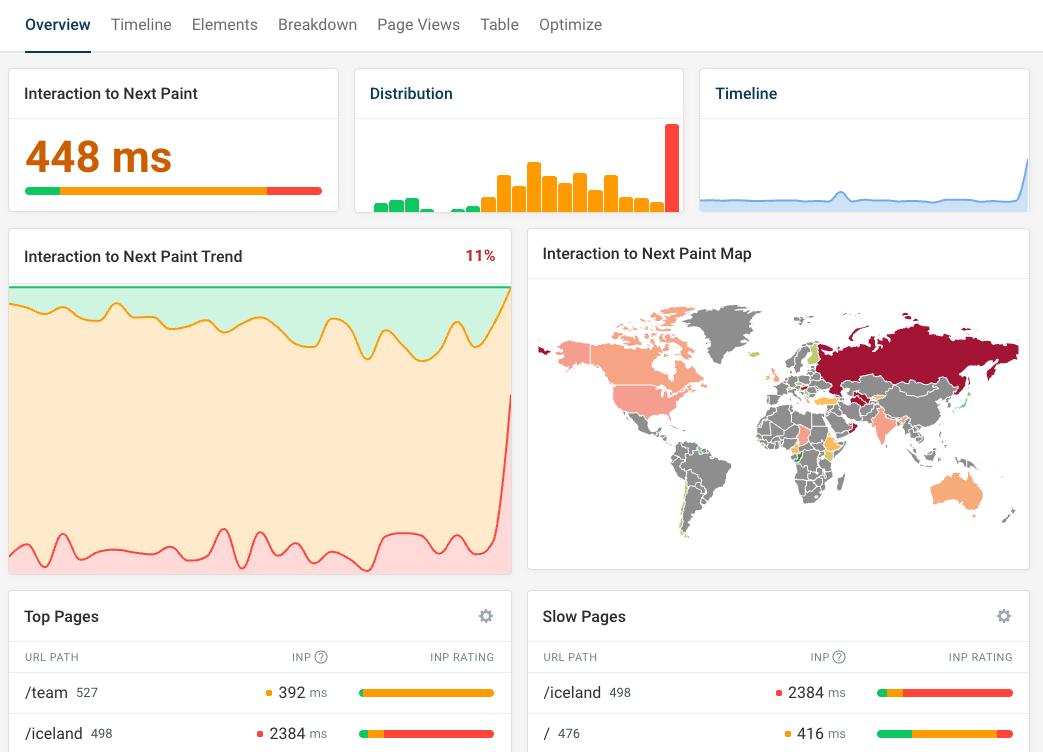
By default, metrics are attributed the way CrUX attributes them, so your data lines up with what Google sees. Because that makes debugging harder, each page view also carries INP Path and CLS Path properties recording where the slowest interaction and largest layout shift actually occurred, and you can inspect an individual page view to see the soft navigations that happened on it.
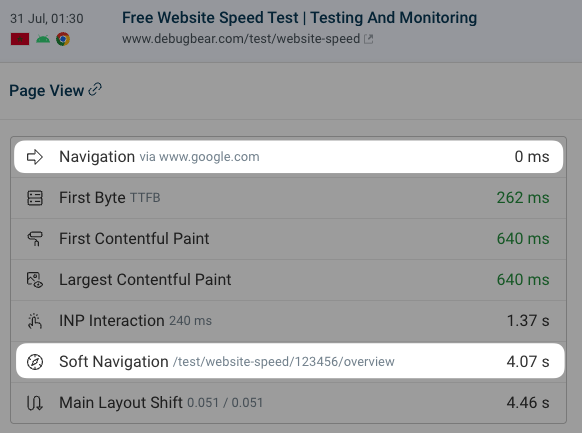
Measuring Core Web Vitals in SPA mode
Alternatively, now that Chrome 151 measures Core Web Vitals for soft navigations, you can enable Track SPA Soft Navigations Individually to report every soft navigation as its own page view.
Each paint, interaction, and layout shift is then attributed to the page it happened on. Here an initial page load and three in-app navigations are reported as four separate page views:
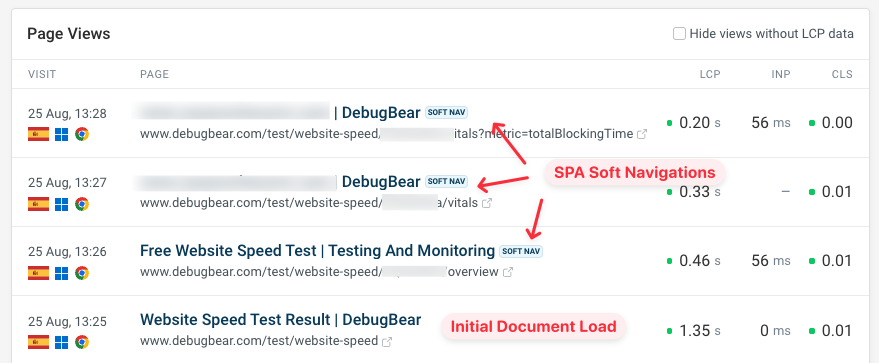
If you later want to look at just the initial page loads, for example to compare against CrUX, you can filter by View Type to exclude soft navigations.
Monitor Page Speed & Core Web Vitals
DebugBear monitoring includes:
- In-depth Page Speed Reports
- Automated Recommendations
- Real User Analytics Data