Why Use DebugBear?
Wondering what makes DebugBear a great tool to speed up your website, and how it's different from other tools?
This article explains what makes DebugBear different.
Built for Core Web Vitals
Google's Core Web Vitals measure how fast your website is and whether it provides a good experience to visitors. Having good Web Vitals means you'll rank higher in Google and have happier users.
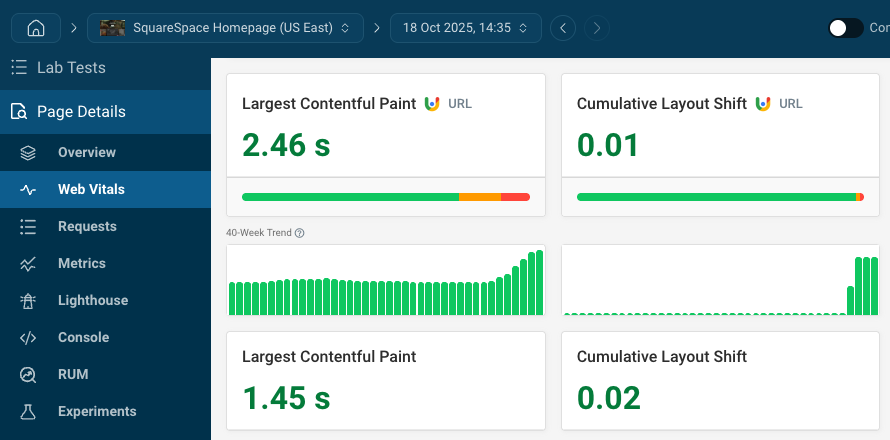
DebugBear is a modern tool that's built with the Core Web Vitals in mind. We track three types of Core Web Vitals data:
- Lab-based page speed data with in-depth reports and recommendations
- Real-user monitoring data providing insight into visitor experiences
- Track Google's CrUX data that impacts SEO
We consider the needs of everyone involved in Core Web Vitals optimization: from clients to Technical SEOs and developers.
Comprehensive web performance data
Making your website fast is not a quick one-off task. DebugBear helps you at each stage of your optimization journey:
- Identify slow pages with our website scan or real user analytics
- Get in-depth technical reporting to identify improvements
- Check that your optimizations are working and get alerted to regressions
Page speed data you can trust
Collecting accurate page speed data isn't easy. Many tools use shortcuts to avoid the cost of setting up a high-quality test environment.
- PageSpeed Insights uses simulated throttling that isn't reliable
- DevTools also doesn't accurately reflect a real network connection
- Other tools, like Pingdom or Datadog, run tests directly on a fast data center network connection
DebugBear runs tests in a controlled lab environment that reflects the experience of real users.
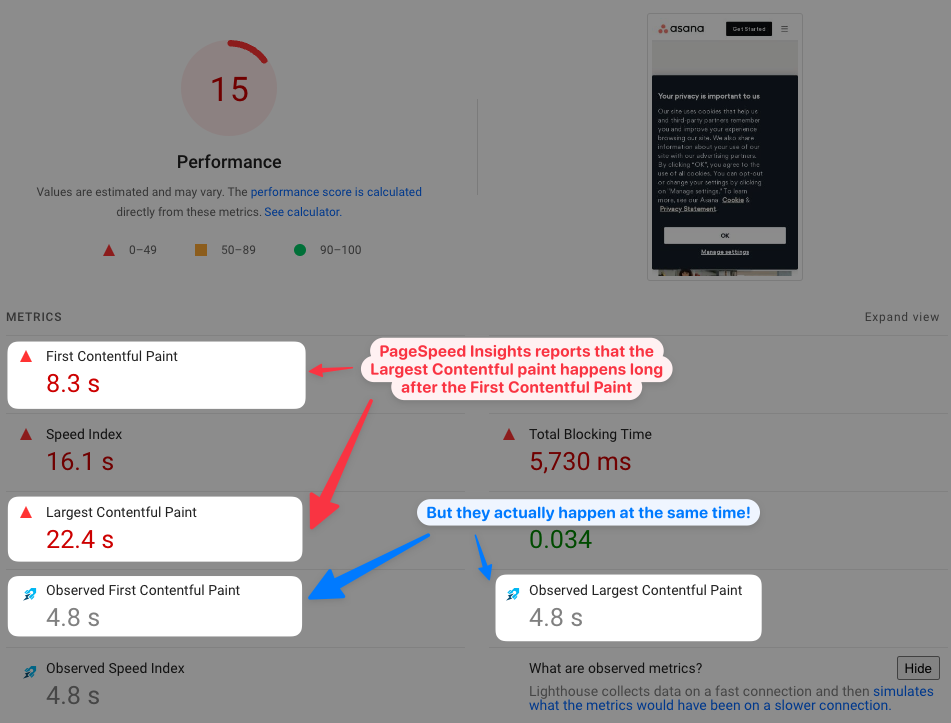
Compare that with this test result from PageSpeed Insights (actual measured data surfaced by our Site Speed Chrome extension). The Largest and First Contentful Paint events happen at the same time, but PSI says the LCP happens much later.
Sometimes PageSpeed Insights even reports that the website would load faster on a slower connection!
Even other paid site speed tools often only report low quality data. This also applies to SEO tools like Moz.
Detailed test reports
A lot of stuff happens when loading a website, and it's often hard to find out what's really slowing it down.
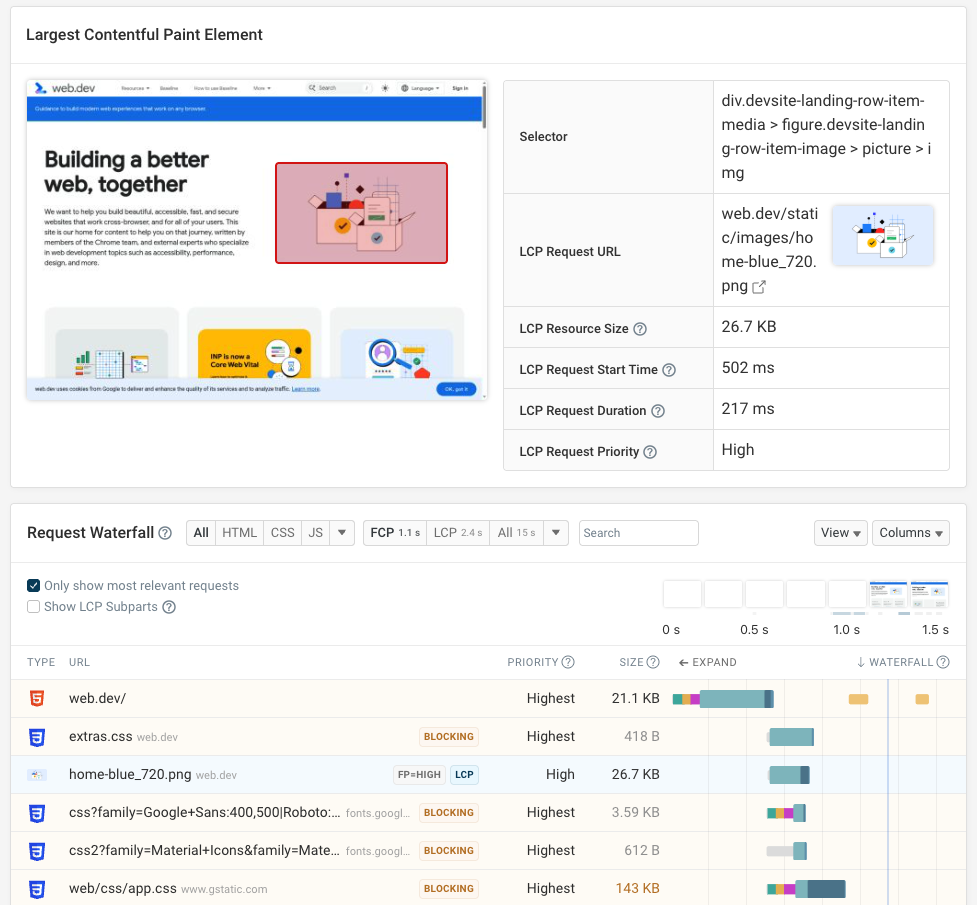
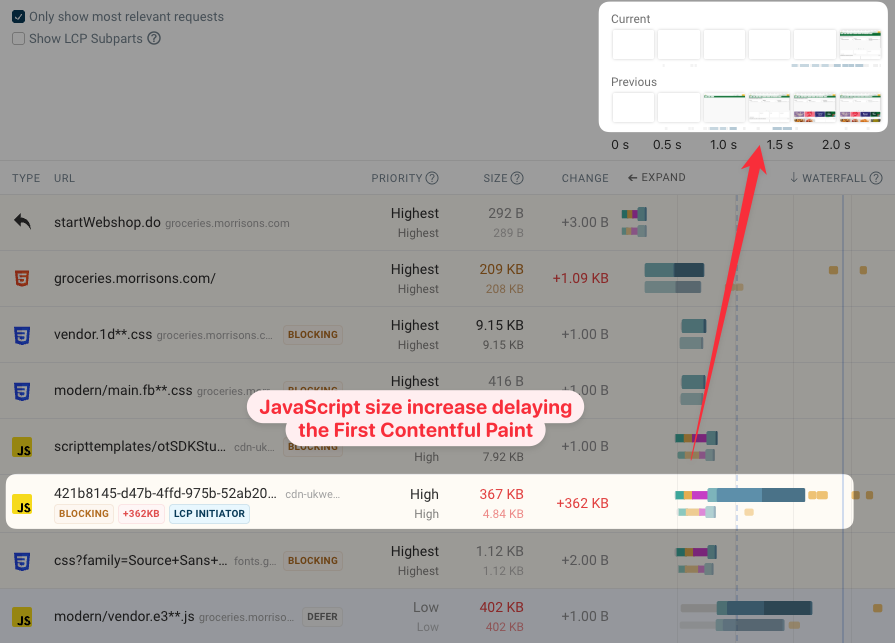
DebugBear provides a tailored report for every performance metric that surfaces only the relevant data. That includes a detailed request waterfall that shows more than just a list of requests:
- See the priority of each request and how bandwidth is used to download the response
- Quickly identify render-blocking requests, preloaded resources, or the LCP image
Finally, all this data is put into context by showing the rendering progress at each point in time as well as CPU activity for each resource.
Easily compare test results
Tracking down the cause of a site speed regression can be hard. DebugBear lets you see test results side by side and highlights differences, helping your team see what changes caused the problem.
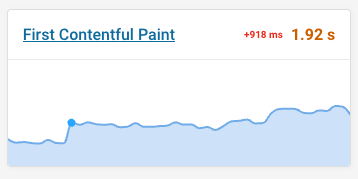
Enable compare mode to see test results side by side. The video view shows you what difference the change makes to visitor experience.
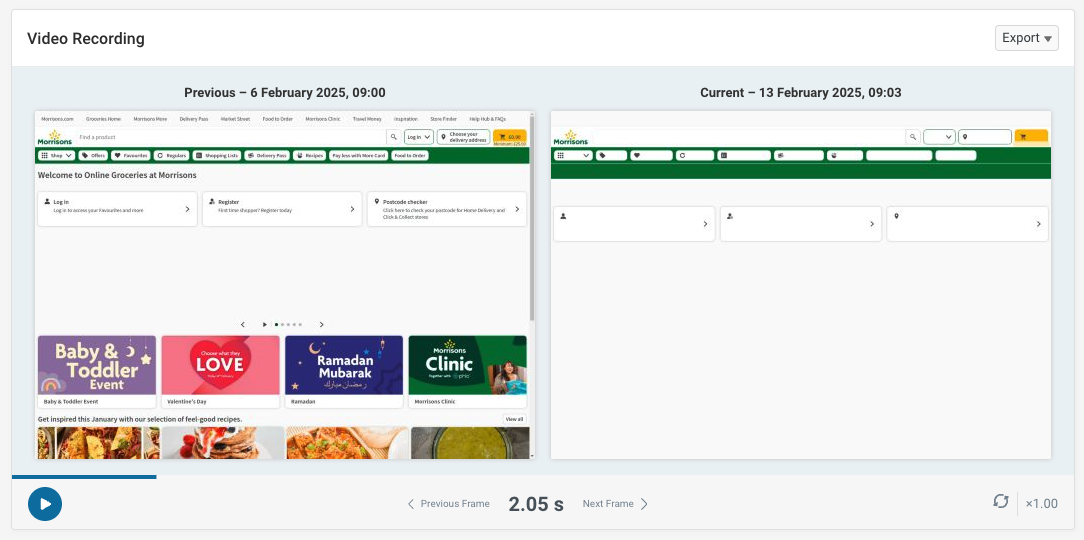
You can then deep dive into the technical data. Here we see that the size of a render-blocking script increased.
As a result, it takes longer to download and the page remains blank for longer. You can then check what caused the size increase and if the JavaScript code can be optimized to make the page load faster again.
This also works for optimizations. Check what change caused an improvement and share the user impact with clients or team members by exporting the video recording.
Configurability and advanced settings
While being easy to set up, DebugBear also supports many advanced features:
- Over 30 global test locations
- Set up custom test devices
- Test pages that require login or Basic Authentication
- Handle age gates or consent banners
Can we build this in-house?
Building a Lighthouse monitoring system in-house generally isn't a good idea:
- You'll get unreliable simulated metrics from Lighthouse
- Custom systems are difficult to maintain over time and you'll need to divert engineering time away from other projects
How is DebugBear different from Lighthouse?
In addition to providing higher-quality data than Lighthouse, DebugBear data is also more detailed and provides custom insights and recommendations.
And of course DebugBear monitors your website continuously, keeps a history of the results, and alerts you to changes.
In addition to the lab-based Lighthouse tests, DebugBear also keeps track of Google Core Web Vitals data and provides a custom real user monitoring solution.
Real-user monitoring
In addition to running high-quality lab tests, DebugBear also lets you collect in-depth real-user Core Web Vitals data.
You can track how many page views meet the Core Web Vitals, and use annotations to mark deployments or other changes on your website.
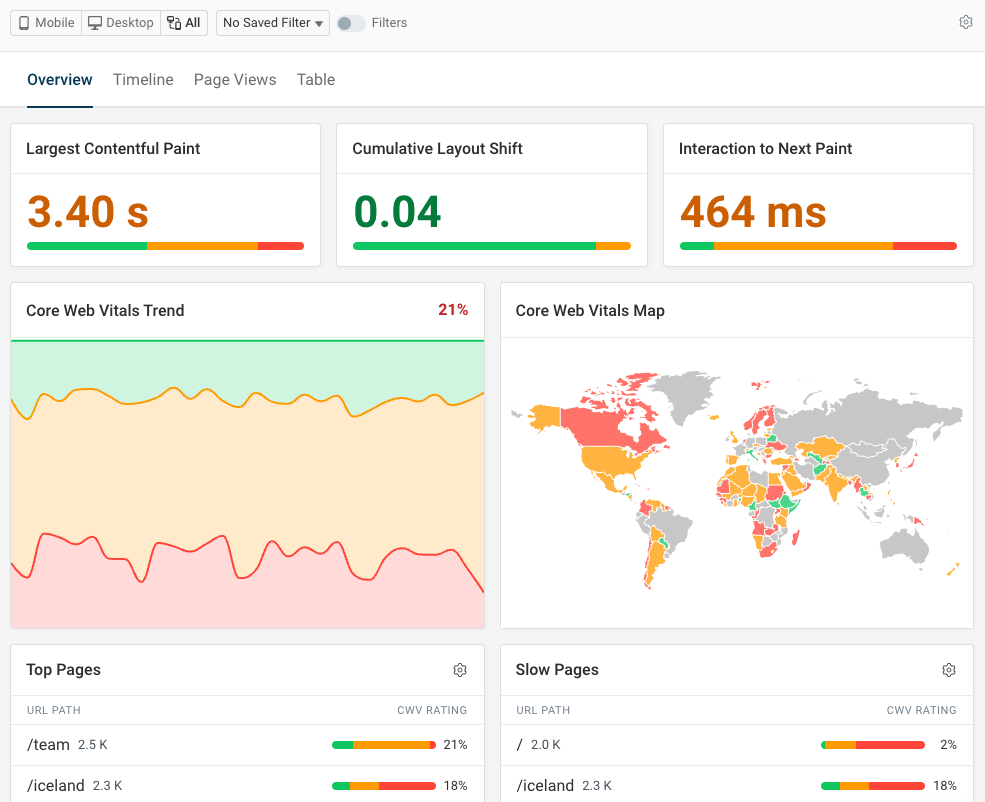
Get page speed data for all pages on your website, and see what page elements are responsible for the Largest Contentful Paint, Cumulative Layout Shift, and Interaction to Next Paint.
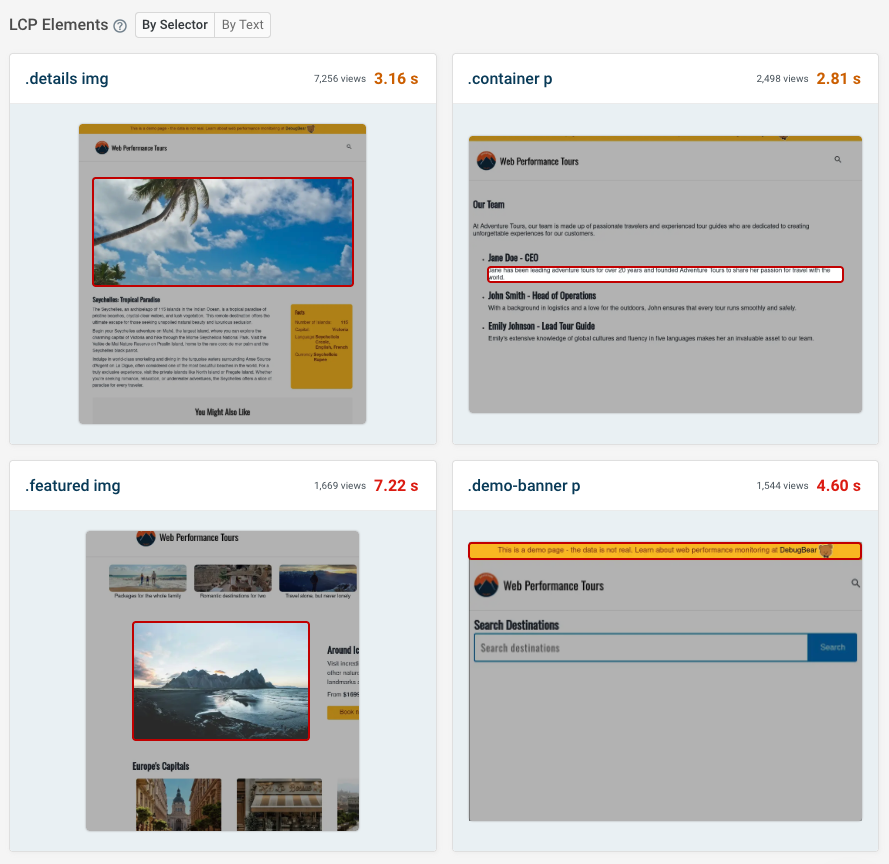
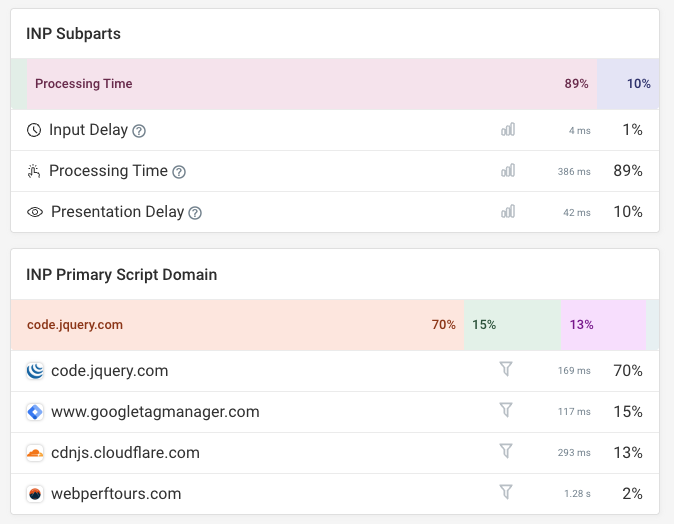
Google's new Interaction to Next Paint metric is often hard to debug. DebugBear shows what scripts are responsible for processing delays, and what events or other triggers cause code to run.
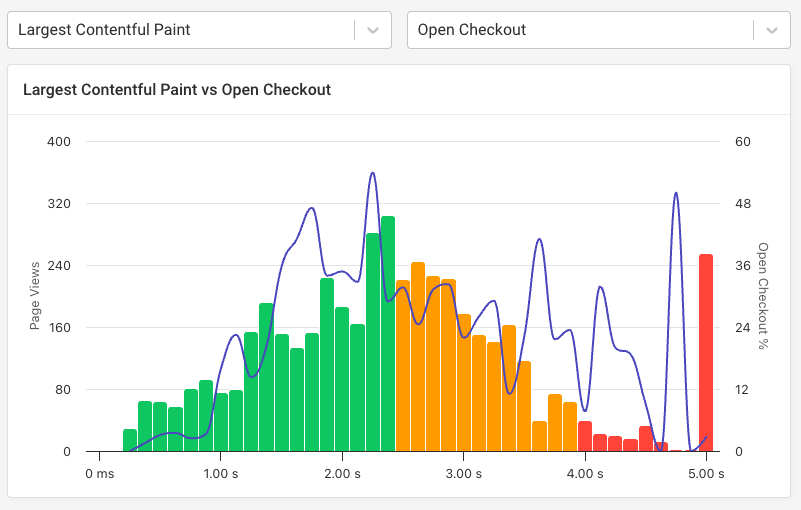
Set up conversion tracking to see how website performance impacts user experience and business outcomes.
What our customers say
Some of our customers have shared their experience in one of our case studies. Here are some of the things they've said:
DebugBear has been a game changer in how we monitor and improve page speed for our clients. It's the perfect workflow to monitor and fix page speed issues before they start impacting Google rankings.
Steve Walker, Technology Director at Journey Further
We've updated around 15,000 pages and saw some nice gains from it. "Good URLs" and their impressions have increased 3x since implementation.
Rafayel Begoyan, Senior SEO Specialist at CoinStats
We love DebugBear. It has proven useful time and time again. I evaluated the different competitors and DebugBear was the best overall product.
Rafael Corral, Senior Software Engineer at Medium
The reporting data is very helpful in pinpointing what causes site speed issues – immediately actionable. It's well above and beyond the info you get from Lighthouse and the performance tests through Chrome.
Loren McDonald, IT Director at Manncorp
DebugBear's dashboard lets us see Core Web Vitals at a glance. At the same time, we're able to examine each result in a developer-friendly way.
John Bacon, Product Manager at GigSalad
Try DebugBear for free
Start monitoring your website with a free 14-day trial, or run a free site speed test here.


Monitor Page Speed & Core Web Vitals
DebugBear monitoring includes:
- In-depth Page Speed Reports
- Automated Recommendations
- Real User Analytics Data