Total Blocking Time (TBT): What It Is And How To Reduce It In Lighthouse
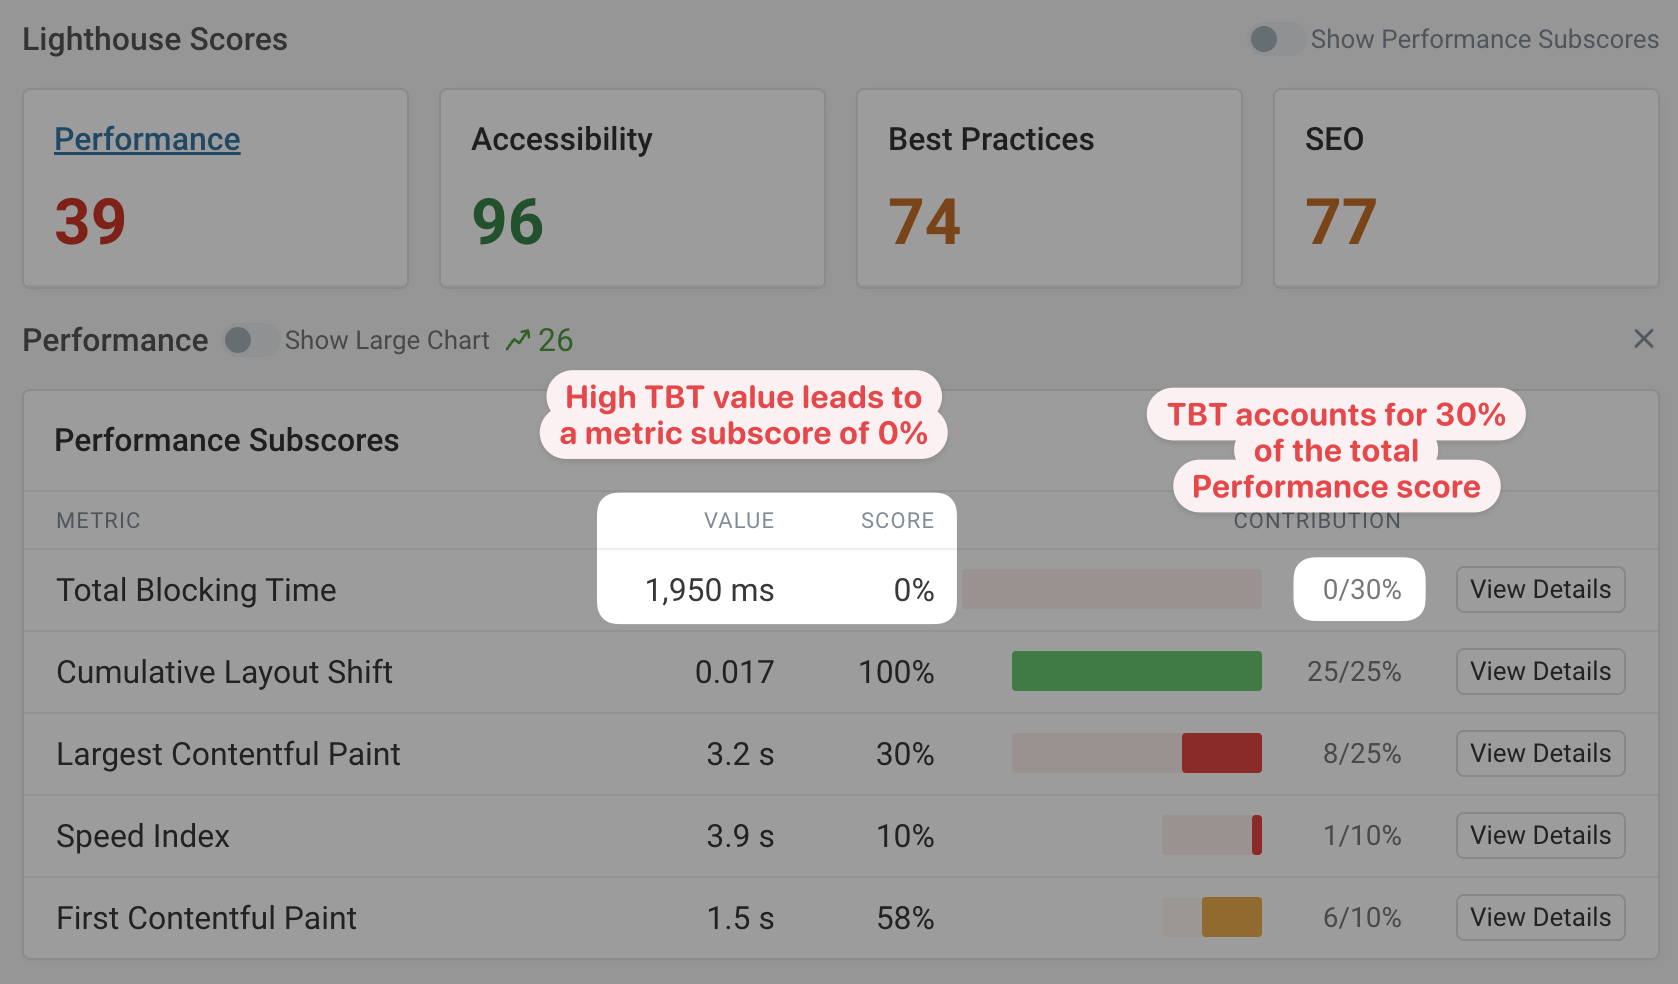
Total Blocking Time (TBT) is a web performance metric that Google uses to assess the page speed impact of CPU processing tasks. It makes up 30% of the Lighthouse Performance score, more than any other single metric.
This article explains how Total Blocking Time is defined, what counts as a good score, what causes high blocking time, and how to measure and reduce it.
What is Total Blocking Time?
Total Blocking Time (TBT) measures how long the main thread is blocked by long CPU tasks while your page loads. CPU tasks shorter than 50 milliseconds don't count as blocking and don't contribute to your TBT score. Any time over 50 milliseconds does increase Total Blocking Time.
Blocking time is bad for user experience because the browser can't handle user input while the CPU is blocked. A high Total Blocking Time in a lab test result is often correlated with poor Interaction to Next Paint (INP) for real users. That's why TBT can be useful as a proxy for the INP metric.
How to check Total Blocking Time for your website
The quickest way to check TBT is to run a free DebugBear website speed test. Enter your URL and the test result shows your Total Blocking Time along with the CPU tasks that cause it. You can also use Google's PageSpeed Insights tool.
The screenshot below shows an example test result with a high Total Blocking Time score. There are a couple of CPU tasks longer than 50 milliseconds, shown in blue. But most of the TBT comes from one long 1.7 second CPU task (shown in red).
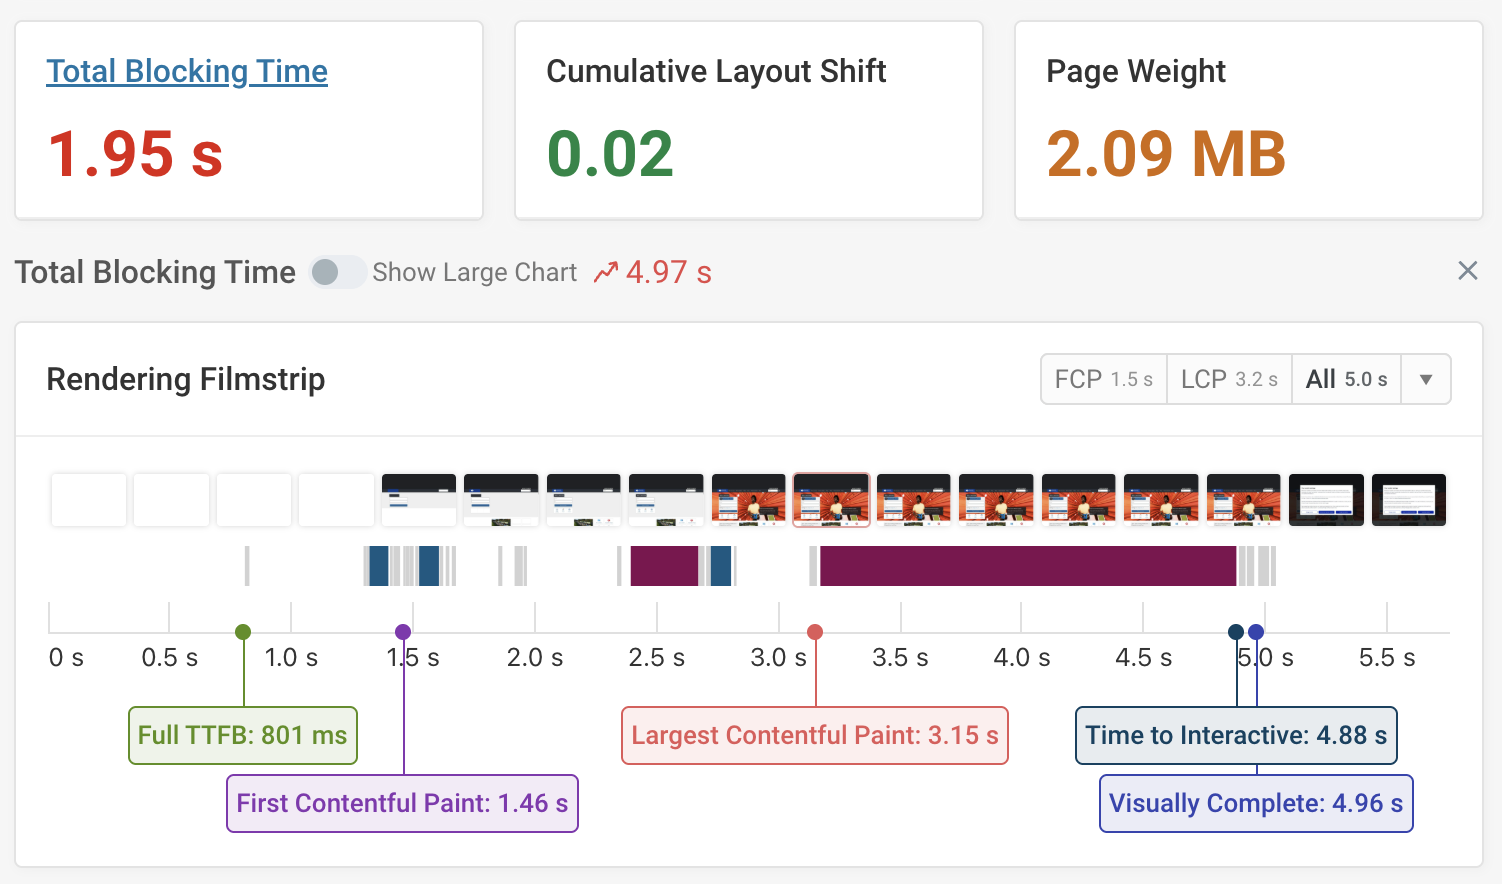
JavaScript execution is the most common type of long-running CPU task, but parsing HTML or updating the page layout can also block user interactions.
What CPU tasks contribute to Total Blocking Time?
Not every long task increases your TBT score. Instead, it needs to fulfill the following criteria:
- The task has to be a main thread task that blocks the page rendering process (in contrast to out-of-process iframes or worker threads that run independently of the main thread)
- The task must run after the First Contentful Paint (FCP) rendering milestone
- The task must run before the Time to Interactive (TTI) threshold
If each of these applies to a CPU task, then any time in excess of 50 milliseconds increases Total Blocking Time. For example, a 400 millisecond task will contribute 350 milliseconds to your TBT score.
Check out this video to find out more about how the Total Blocking Time metric works and how to optimize it.
Total Blocking Time in Lighthouse
TBT is the single biggest contributor to the Lighthouse Performance score, although if you add up the various page load time metrics their total contribution is larger.
Lighthouse also powers Google's PageSpeed Insights tool, so Total Blocking Time has the same score contribution there as it has when running a Lighthouse speed test elsewhere.
How long CPU tasks impact Total Blocking Time and interaction delays
This picture shows an example main thread timeline where a user interacts with the page while a long blocking task is in progress. As a result, the browser can't start processing the click event until the existing task has finished running. This shows up as the Input Delay component of the Interaction to Next Paint metric.
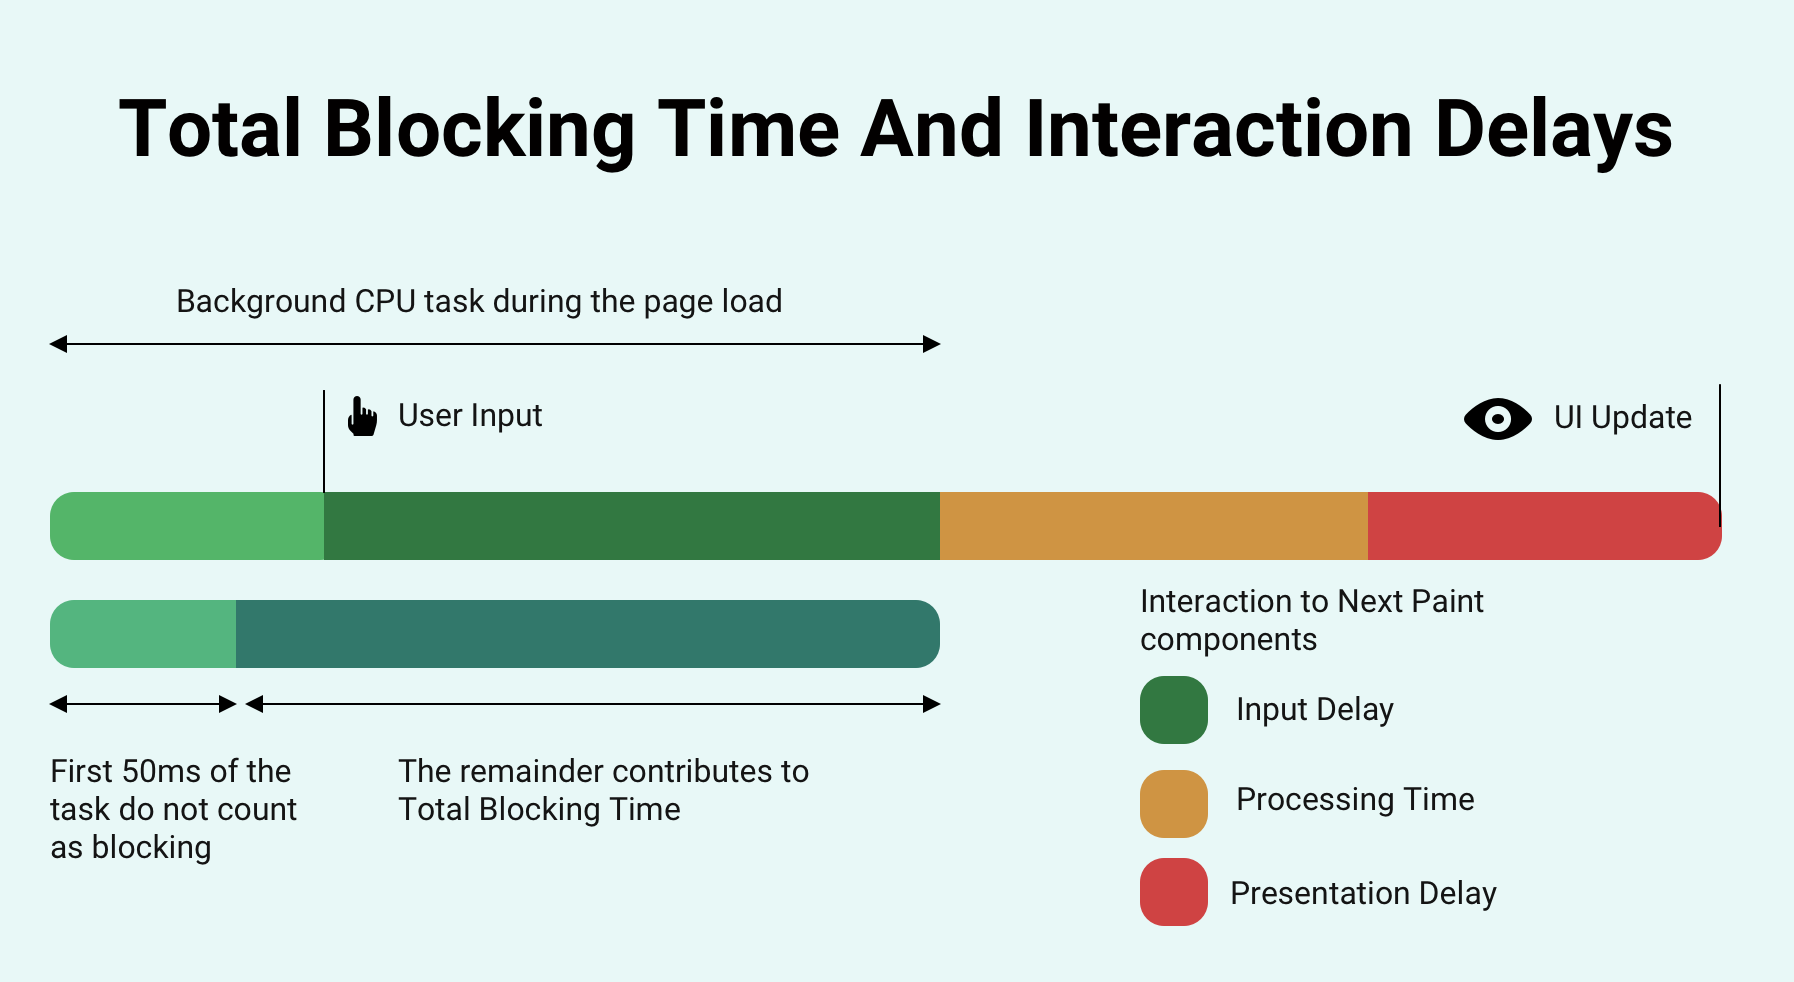
Why don't short CPU tasks contribute to Total Blocking Time in the same way as tasks that take longer than 50 milliseconds to run?
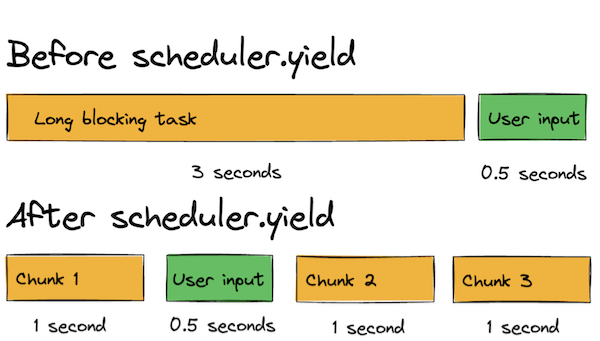
Shorter CPU tasks during the page load process have much less impact on the user experience. Take a look at this diagram showing a similar interaction to before, but this time the long blocking task is split into multiple smaller steps.
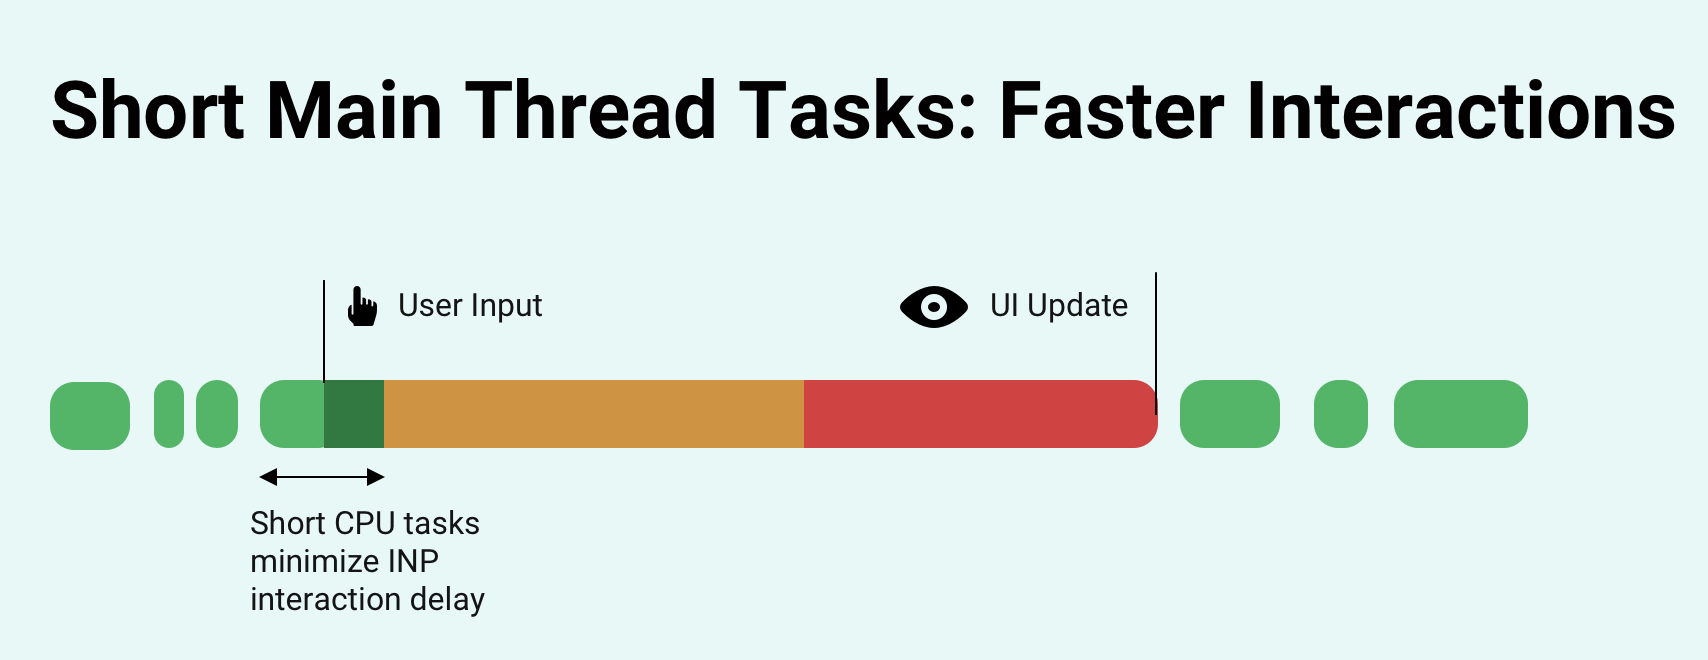
Before the browser continues with the background tasks, it has some breathing room to handle the user interaction. Since the background task that's active at the start of the interaction is shorter, the INP Input Delay component is very small. This results in an overall lower Interaction to Next Paint score and a significantly better user experience.
One way to avoid long CPU tasks is by using the scheduler.yield() browser API which allows the browser to take some time to do other stuff before returning to the prior task.
What's a good Total Blocking Time?
Ideally, TBT should be under 200 milliseconds on mobile and under 150 milliseconds on desktop. These are the values you need for a Lighthouse TBT subscore of 90, which is the start of the green range.
| Rating | Mobile TBT | Desktop TBT |
|---|---|---|
| Good | Under 200 ms | Under 150 ms |
| Needs improvement | 200 ms to 600 ms | 150 ms to 350 ms |
| Poor | Over 600 ms | Over 350 ms |
The thresholds are more lenient on mobile because Lighthouse simulates a slow phone CPU, which makes it harder to avoid some longer processing delays.
If you have a high Total Blocking Time score that means that the website is busy a lot of the time while your page is loading. That slows down both user interactions and the page rendering process.
How does Total Blocking Time impact the Lighthouse Performance score?
TBT determines 30% of the overall Lighthouse Performance score. Lighthouse maps the raw TBT value onto a scoring curve, so there is no single pass or fail threshold. The table below shows the values you need for a TBT subscore of 90 (green) and 50 (orange).
| TBT subscore | Mobile TBT | Desktop TBT |
|---|---|---|
| 90 | 200 ms | 150 ms |
| 50 | 600 ms | 350 ms |
For example, a mobile TBT of 400 milliseconds lands between the two values and results in a subscore of roughly 70. Reducing it to 200 milliseconds would raise the subscore to 90 and the overall Performance score by about 6 points.
You can use DebugBear to continuously measure Total Blocking Time and other web performance metrics for your website.
Is Total Blocking Time a Core Web Vital?
No. The Core Web Vitals are Largest Contentful Paint, Interaction to Next Paint, and Cumulative Layout Shift, and Google collects them from real users. Total Blocking Time is a lab metric that only tools like Lighthouse report. It's useful as a proxy for INP because long main thread tasks cause both.
Lab tools calculate TBT without any user interaction, adding up the blocking portion of long tasks between First Contentful Paint and Time to Interactive. INP instead looks at how long the page takes to respond when a visitor actually clicks, taps, or types.
A high TBT suggests that visitors are likely to run into input delays, but only INP tells you if they really do.
Does Total Blocking Time impact SEO?
TBT can impact the Core Web Vitals of your website, which are a Google ranking factor. However, Total Blocking Time does not directly impact rankings, as Google doesn't collect it in the Chrome User Experience Report.
Long-running CPU tasks delay rendering and interactions. Therefore, Total Blocking Time increases both Interaction to Next Paint and Largest Contentful Paint.
Blocking time causing slow Interaction to Next Paint
CPU processing on the main thread causes INP delays. Lighthouse blocking time only reflects background tasks that happen while the page is loading or after the initial load.
However, main thread tasks during the initial load aren't necessarily the primary cause of poor Interaction to Next Paint. Often CPU tasks are triggered after an initial page interaction or run in response to the user input itself.
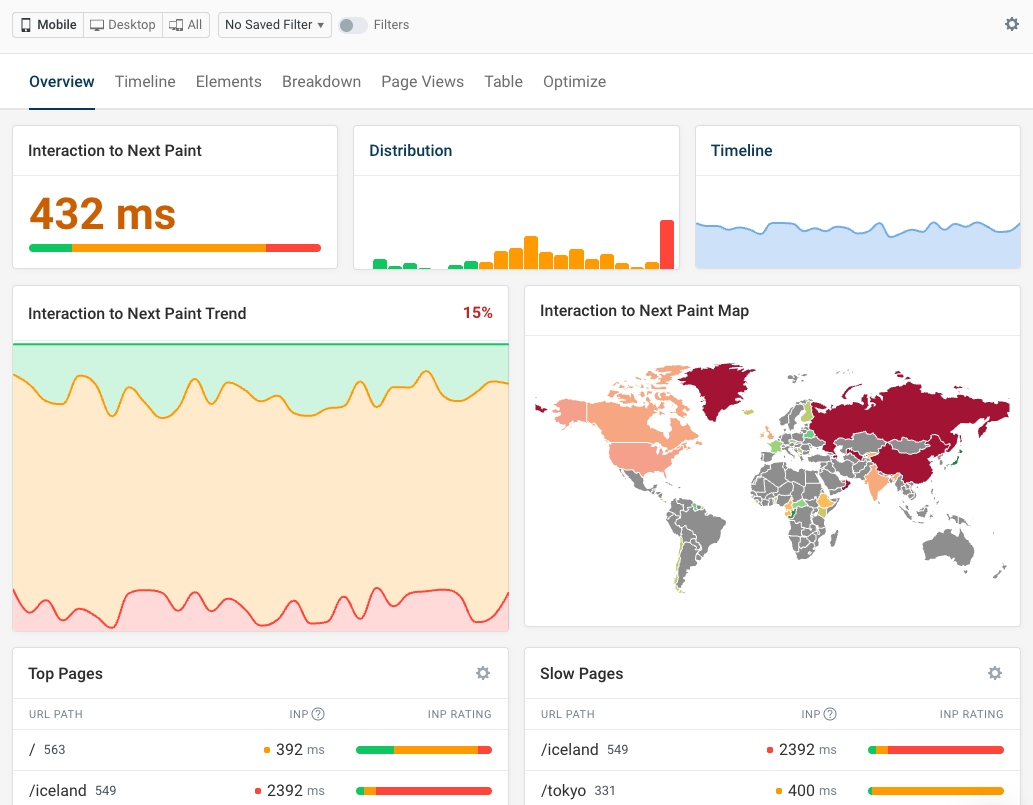
Real user monitoring can help you understand what CPU tasks are actually causing problems on your website. You can see what pages have poor response times, what page elements users are interacting with, which elements are causing poor INP, and what scripts are delaying rendering.
Actual visitor analytics also allow you to deep dive on specific page views and see what code was running during an interaction. The Long Animation Frames API reports when rendering on the page is frozen and what code is causing the issue.
Here you can see that a CPU task was triggered by a JavaScript setTimeout call. This code is running unrelated to the interaction, but it's causing blocking time and delaying the page from updating. Accordingly the breakdown shows it as input delay, while the time spent actually handling the interaction counts as processing time.
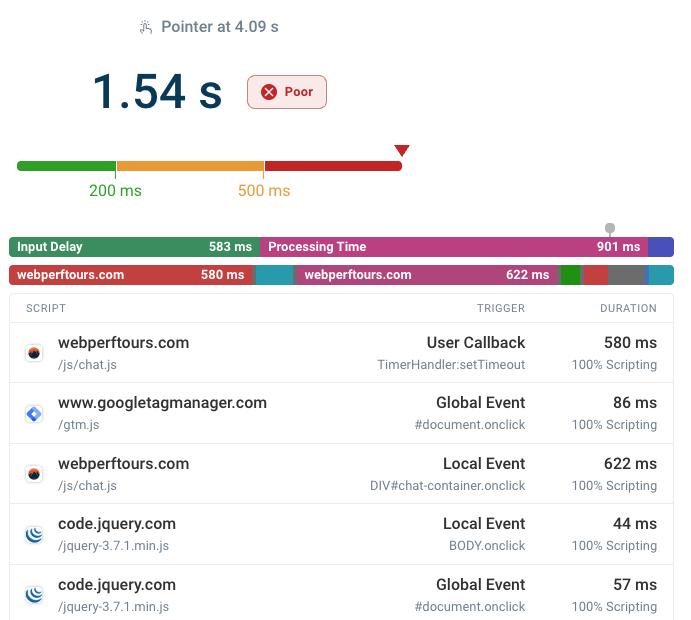
High Total Blocking Time can cause poor INP scores with a large amount of Input Delay.
Total Blocking Time and Largest Contentful Paint
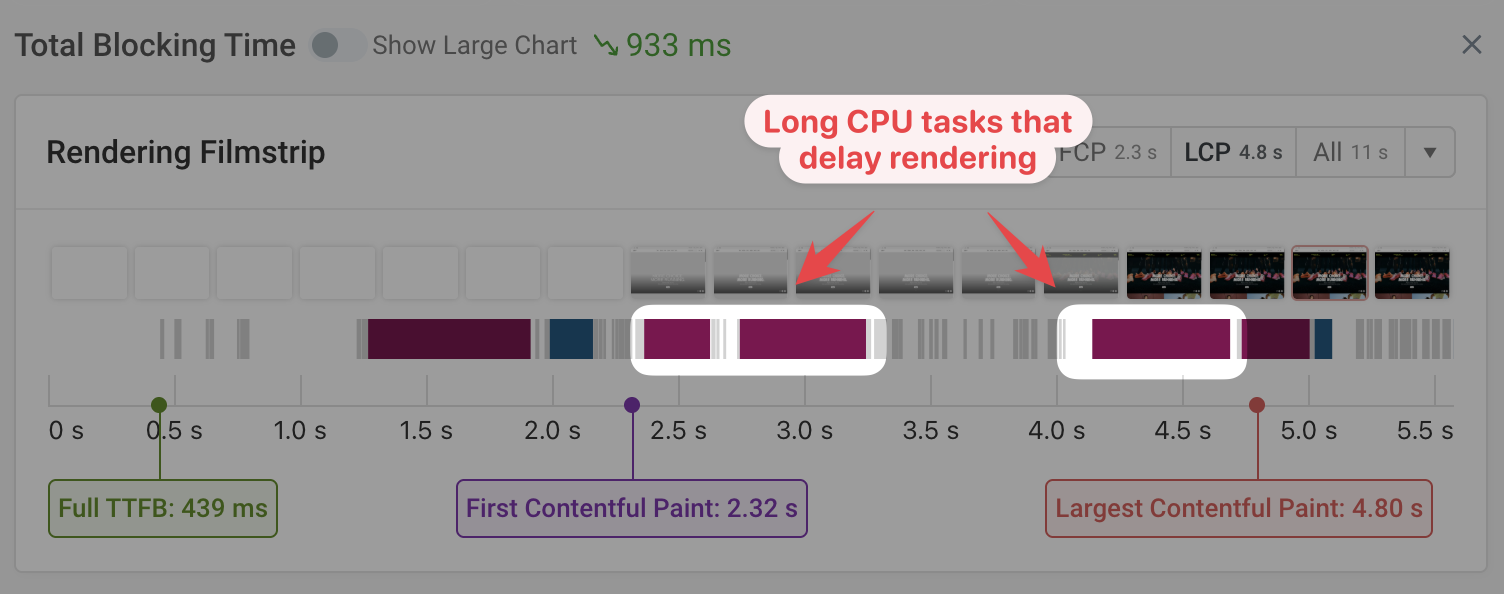
Long CPU tasks after the First Contentful Paint rendering milestone can delay the largest content element from rendering, resulting in high Largest Contentful Paint scores.
The example below shows three long CPU tasks delaying more important processing tasks on the page.
Total Blocking Time vs. Time to Interactive
The Time to Interactive metric measures how soon after opening the page the network and CPU become idle. While Total Blocking Time measures the duration of blocking CPU tasks, TTI measures when there are no more blocking CPU tasks active on the page.
Time to Interactive does matter for your Total Blocking Time score as any long tasks after the TTI milestone don't contribute to your TBT metric.
Why does Total Blocking Time vary between tests?
The "interactive" milestone can vary significantly depending on how long the CPU happens to be quiet at any given point, so tasks that run just before or after it can flip in and out of the TBT calculation. CPU performance also varies between test runs, and Lighthouse uses simulated throttling, which estimates task durations rather than measuring them directly.
Run several tests and compare the median to get a reliable number.
What causes high Total Blocking Time?
Before you can reduce TBT you need to know where the blocking time comes from. These are the most common causes:
- Long JavaScript tasks: Large script bundles need to be parsed, compiled, and run. If initialization happens in one task the whole thing blocks the main thread. Check the script evaluation breakdown to see which files are responsible.
- Third-party scripts: Tag managers, ads, chat widgets, and A/B testing tools often run large amounts of code during the page load. Third-party code is frequently the biggest single contributor to TBT.
- Unused JavaScript: Code that's never run still has to be downloaded and parsed. Reducing unused JavaScript shrinks the work the browser has to do before the page becomes interactive.
- Layout and style recalculations: A large DOM makes every style and layout update more expensive, and forced reflows in JavaScript can trigger layout work many times during a single task.
- CPU throttling in the test environment: Lighthouse throttles the CPU to simulate a mid-range phone. A task that takes 100 milliseconds on a laptop can take 400 milliseconds in the test, which is why TBT is often much higher on mobile than on desktop.
The How to reduce Total Blocking Time section below explains how to fix the first four of these issues. Throttling is a test setting rather than a problem with your page, but it does mean that small amounts of main thread work add up quickly.
How to reduce Total Blocking Time
To improve Total Blocking Time on your website you need to find out what's causing long main thread tasks, eliminate unnecessary scripts, and optimize your JavaScript code:
- Profile your website with Chrome DevTools
- Review third-party scripts
- Reduce unused JavaScript
- Split up long tasks
- Make your JavaScript code more efficient
- Use web workers for slow tasks
Profile your website with Chrome DevTools
You can use Chrome DevTools to create a CPU timeline recording that shows you what exactly is happening on the page main thread. You can see script evaluation, style calculations, layout processing, and more.
To record a performance profile:
- Open Chrome DevTools
- Switch to the Performance tab
- Click the Reload and record icon in the top left of the Performance tab
The activity trace that Chrome collects then shows you all the tasks happening on the main thread, as well as the specific code location that was contributing to the task duration.
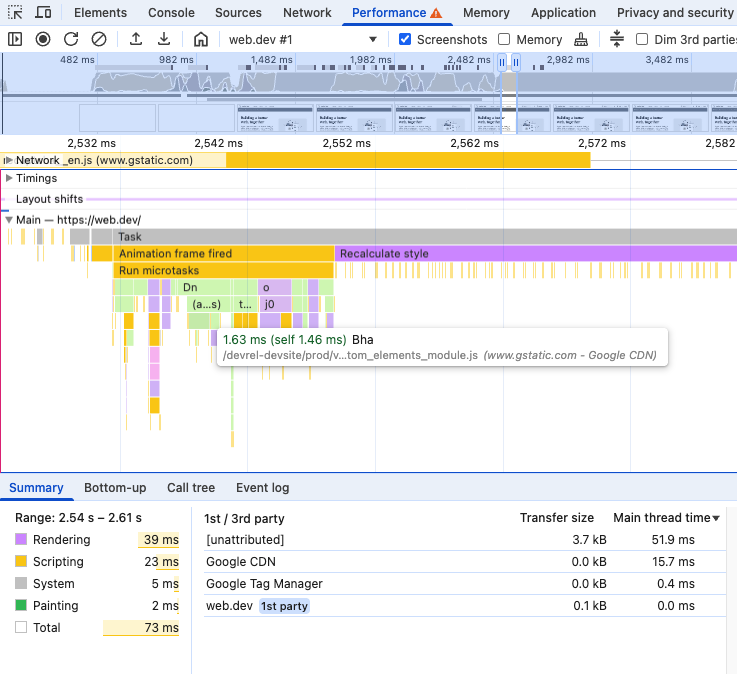
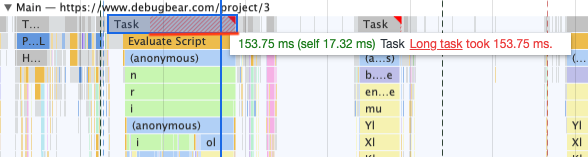
Tasks in the performance trace are marked like this:
- Red triangle in the top right corner: indicates a long task over 50 milliseconds
- Red stripes: indicates blocking time after the first 50 milliseconds
Sometimes you'll see many large layout or style recalculation tasks. If that's the case, reduce how frequently layout recalculations are needed and simplify your website, for example by reducing overall DOM size.
Review third-party scripts
Third-party code like chat widgets or A/B testing tools can add a large amount of CPU processing to your page. Consider if some of them can be removed, or if they can be loaded only when they are needed.
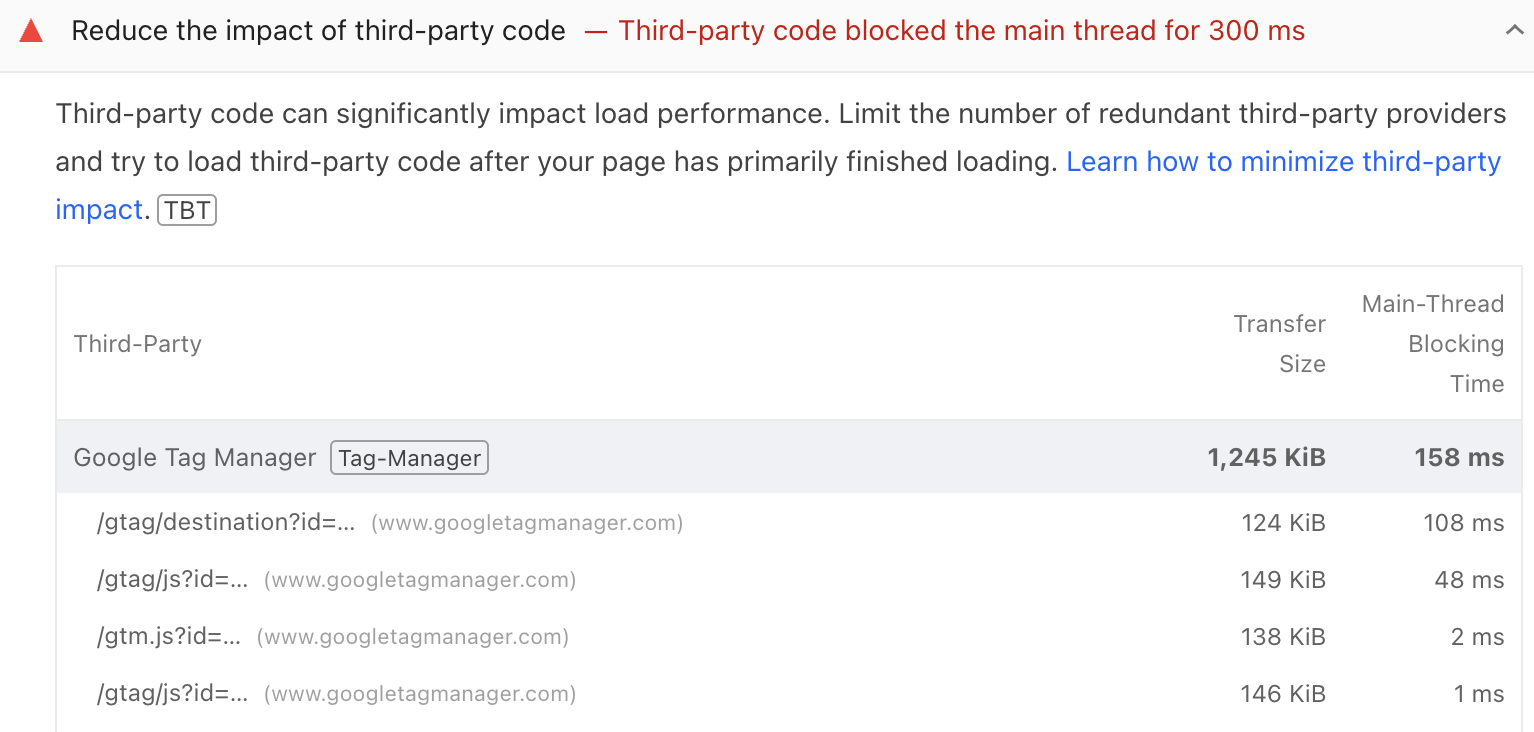
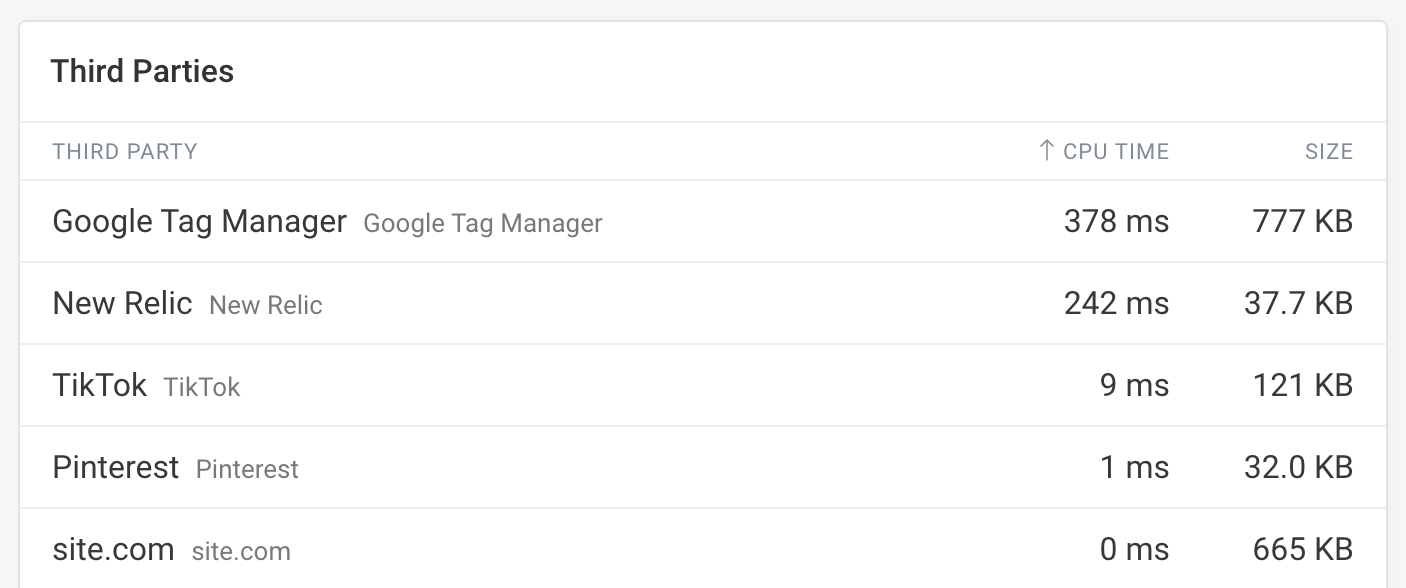
Google's Lighthouse report includes a specific audit checking the impact that third-party code has on your website. For each script you can see how much main-thread blocking time it's contributing to your overall Total Blocking Time score.
Reduce unused JavaScript
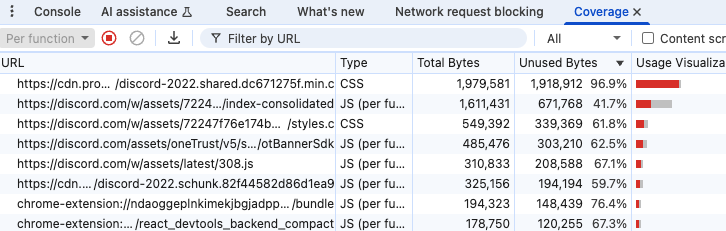
Many websites load large amounts of code that's never actually run. Chrome's code coverage feature can help you identify and remove unused JavaScript.
Unused code still needs to be downloaded and parsed before the script that it's contained in can run. JavaScript bundles also often contain unused libraries that need to be initialized even if they don't end up being used on the page.
Split up long tasks
Instead of running all JavaScript updates in one task, consider doing the work in stages.
For example, if you're rendering a chart and a map, you could first render the chart and then wait 50ms before rendering the map. This way user input can be handled in the gap between the two rendering steps, and the page stays responsive throughout.
The scheduler.yield() API can help here, providing an easy way to process other tasks and handle interactions while a bigger processing task is in progress.
Make your JavaScript code more efficient
Profiling your website code will tell you what types of tasks are causing delays. If your own code is slowing down your website you need to optimize your JavaScript code.
For example:
- You might be loading too much code, causing long parse times
- Your code may need to be optimized to run faster
- Forced reflows may increase task duration
Use web workers for slow tasks
If your website requires long processing tasks during the page load you can sometimes move those tasks off the main thread using web workers.
Instead of blocking the page, these tasks can then be processed in the background while your website remains interactive.
How to measure Total Blocking Time
Many different tools can help you measure and optimize TBT:
- Google's Lighthouse and PageSpeed Insights tools
- The DebugBear speed test
- The Long Tasks API
Total Blocking Time in Lighthouse and PageSpeed Insights
TBT is one of the main metrics shown at the top of each Lighthouse report. You can run Lighthouse on PageSpeed Insights, or in the Chrome DevTools Lighthouse tab.
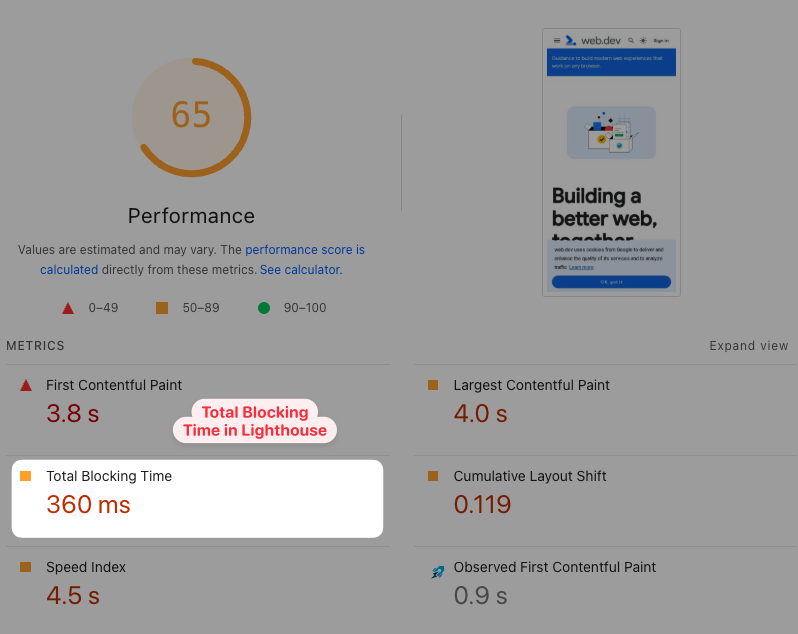
Each Lighthouse report also includes a list of long tasks, and what source file they can be attributed to.
Lighthouse uses simulated throttling to collect data for a throttled mobile CPU speed, which may not always be fully accurate.
Total Blocking Time in the DebugBear speed test
The DebugBear website speed test lets you check TBT and other metrics on your website. After running the test you can click on the Total Blocking Time metric to view additional details and find opportunities to improve page speed.
In addition to running a synthetic performance test, each test result also includes real user metrics from Google's Chrome User Experience Report (CrUX). This gives you an indication if long blocking tasks on the main thread are slowing down user interactions.
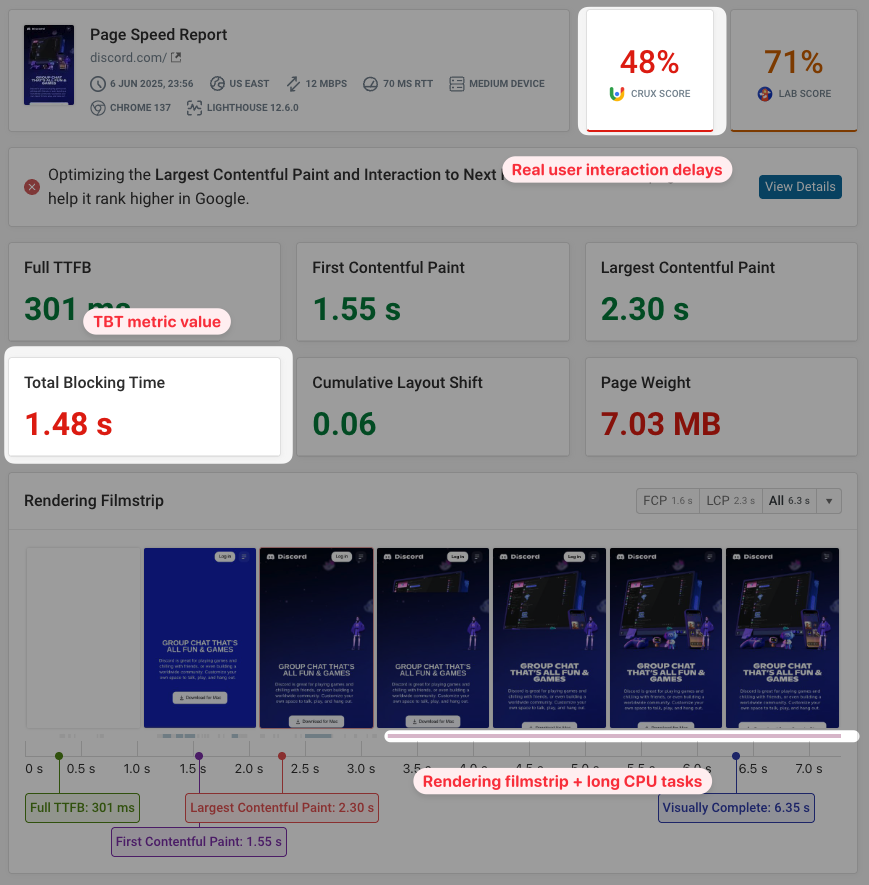
Click into the Total Blocking Time metric in the test result to see the specific scripts that are running when loading the page. Hovering over the red bars shows the script URL and its Total Blocking Time contribution.
A lot of the time you'll find that a small number of scripts are responsible for most of the delay.
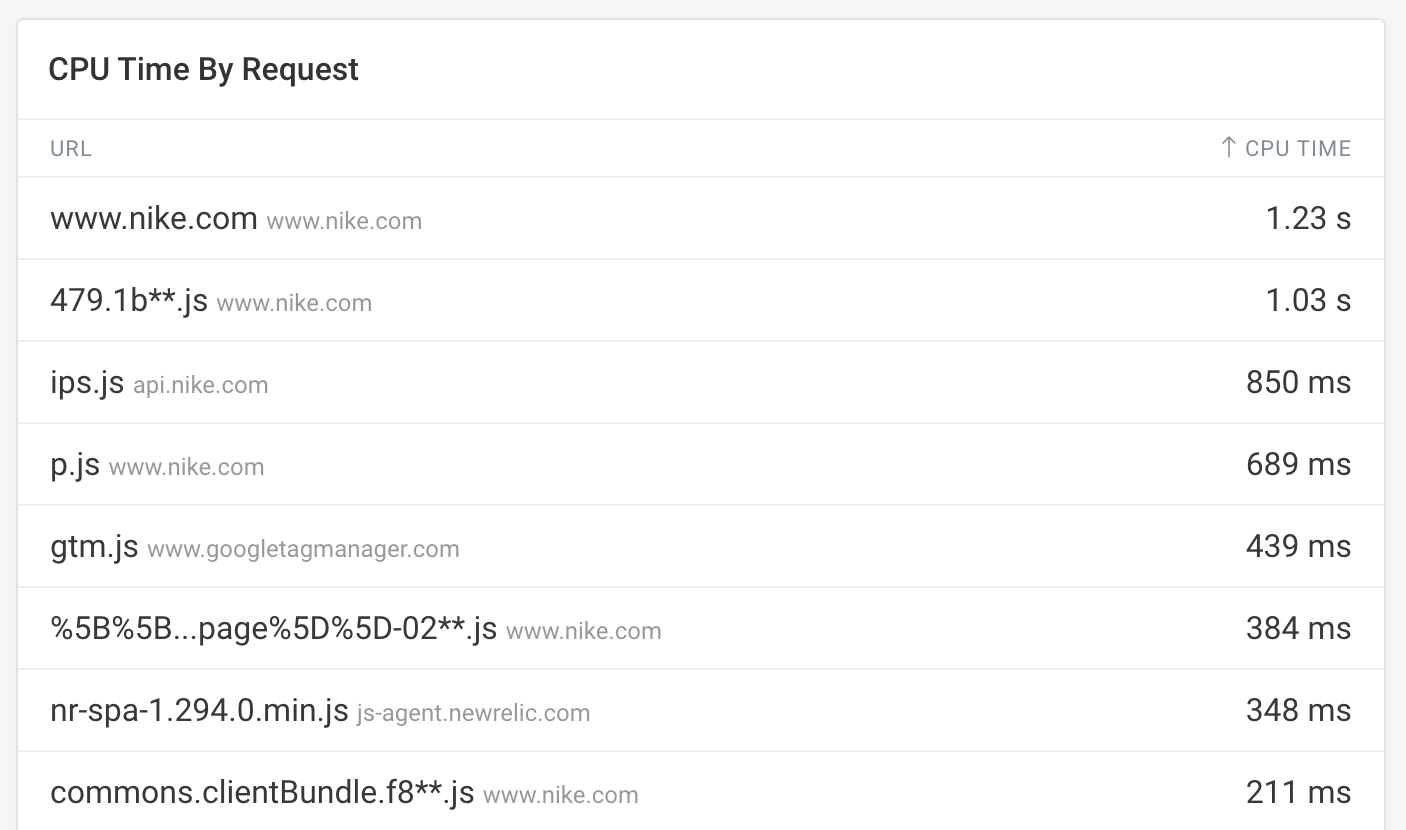
The test result also breaks down CPU tasks by third-party script.
If another service is causing delays on your website you can check whether the script needs to be loaded on the specific page, or contact the service provider's support team for advice on how to fix the page speed issue.
Using the Long Tasks API
The Long Tasks API allows you to detect long CPU tasks using JavaScript code on your website.
Here's how you can calculate Total Blocking Time (without applying the First Contentful Paint and Time to Interactive boundaries):
let totalBlockingTime = 0;
const observer = new PerformanceObserver((list) => {
  for (const entry of list.getEntries()) {
    totalBlockingTime += entry.duration - 50;
  }
  console.log({ totalBlockingTime });
});
observer.observe({ type: "longtask", buffered: true });
The browser console output will show the blocking time in milliseconds.
{ totalBlockingTime: 317 }
The Long Animation Frames API (LoAF) can also report long tasks on your website, and provides additional script attribution capabilities that the Long Tasks API doesn't offer.
How to monitor Total Blocking Time
Web performance monitoring tools like DebugBear let you track Total Blocking Time and other performance metrics by automatically running regular performance tests.
Along with a Lighthouse report you also get additional insights on page load time, CPU tasks, and Core Web Vitals.
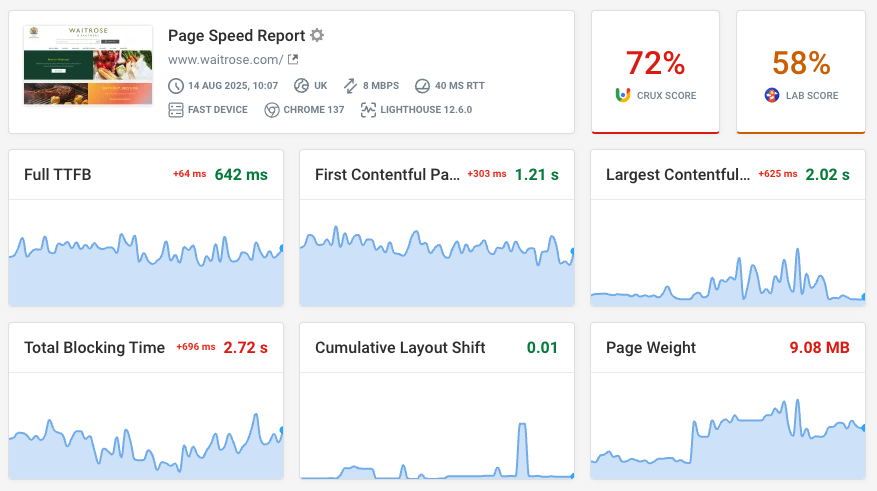
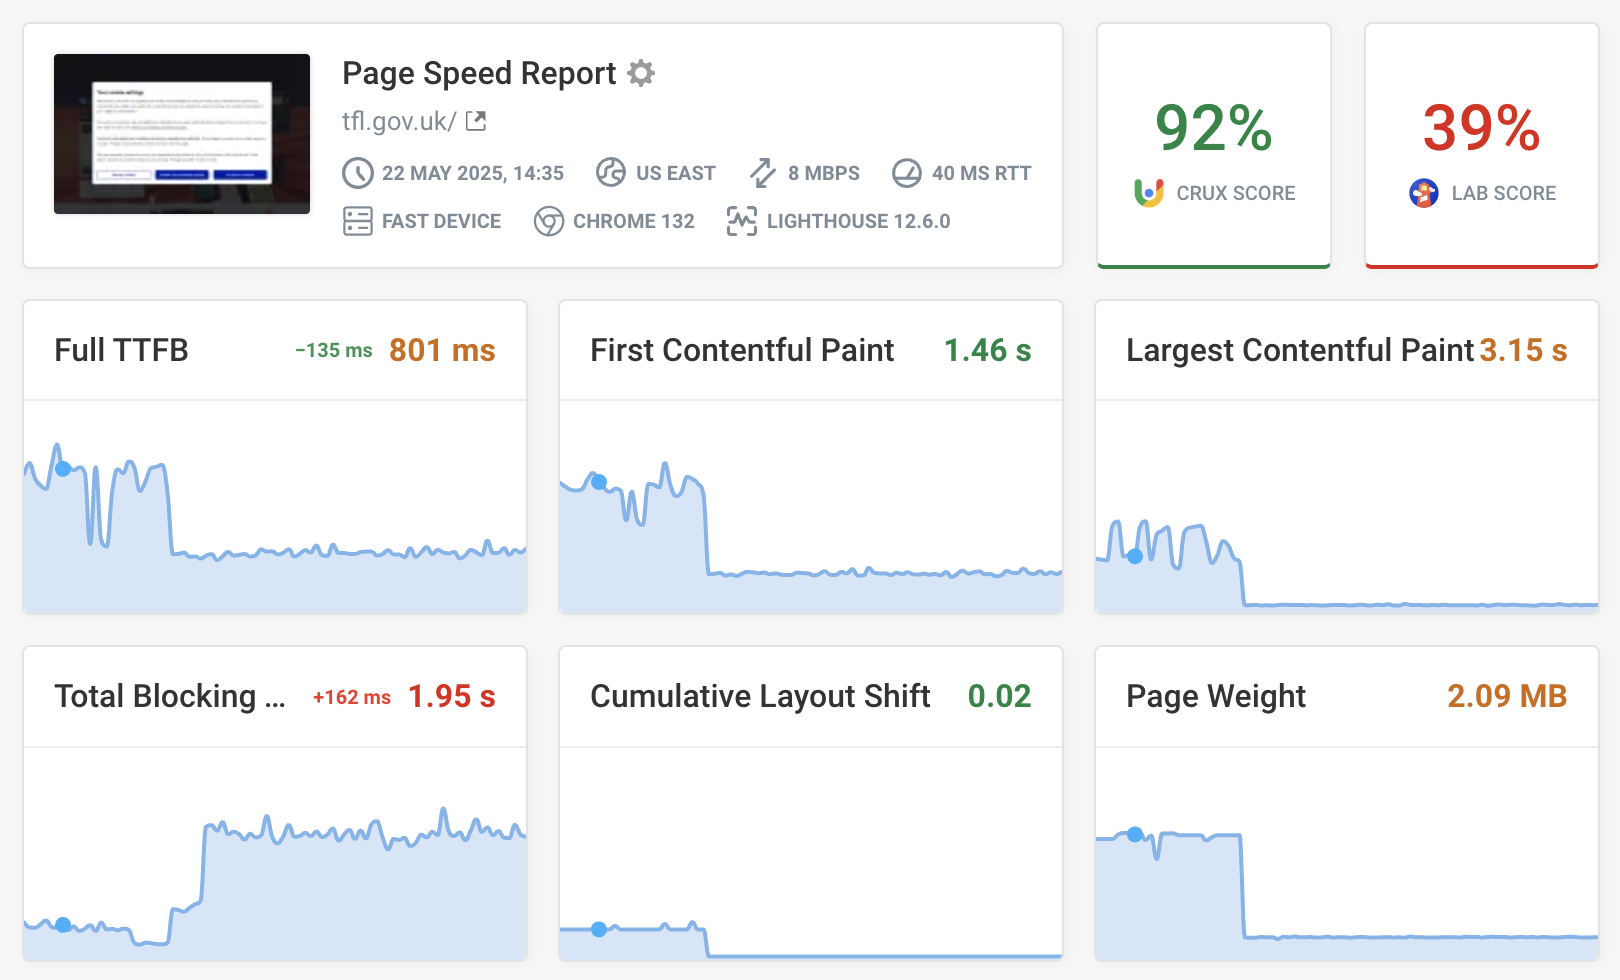
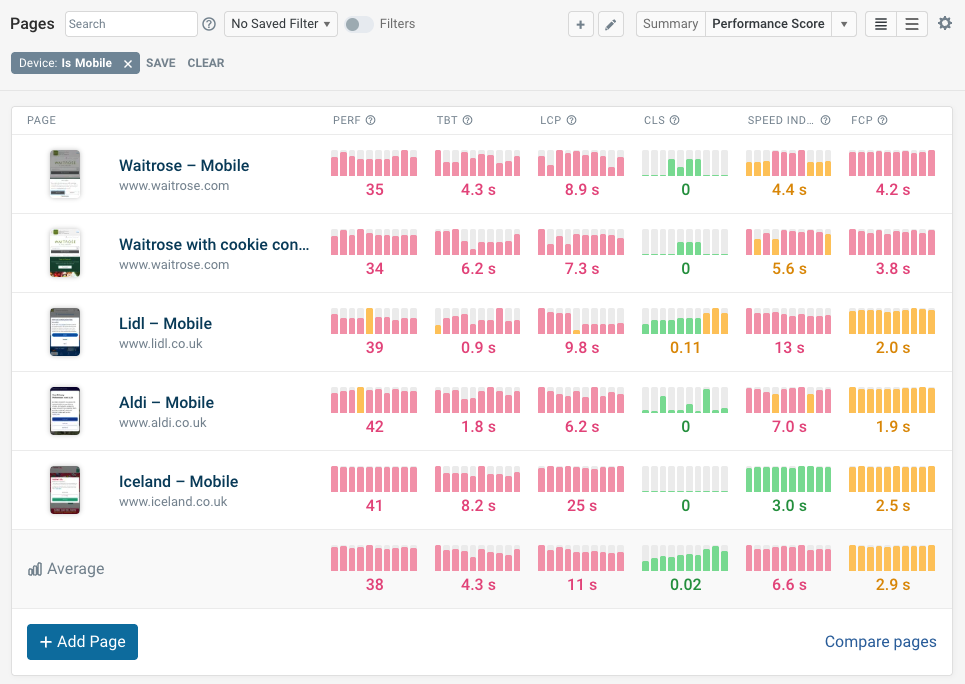
The project dashboard also shows Total Blocking Time, so you can see how performance is trending on your website or compared to competitors in your industry.
Each contributing subscore that makes up the overall Lighthouse performance evaluation appears in the chart below.
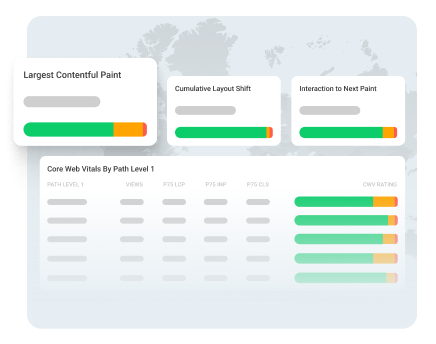
DebugBear combines three different types of web performance data to help you identify poor performance, diagnose issues, and get alerted to regressions:
- Synthetic website monitoring for in-depth scheduled analysis
- Real user monitoring to measure page speed for actual visitors
- Google CrUX monitoring to track Google SEO metrics
Sign up for a free trial to start measuring and optimizing your page speed.
Monitor Page Speed & Core Web Vitals
DebugBear monitoring includes:
- In-depth Page Speed Reports
- Automated Recommendations
- Real User Analytics Data