
Reports from Google's Lighthouse tool report web performance metrics based on a specific network speed. Lighthouse uses a particular network throttling method called simulated throttling.
This article explains what Lighthouse simulated throttling is and how it can lead to inaccurate site speed metrics. We'll also look at alternative ways to test your site speed.
What is Lighthouse and what tools are built on top of it?
Lighthouse is a free tool developed by Google that powers many other services under the hood:
- PageSpeed Insights (Lab Data)
- The Chrome DevTools Lighthouse tab
- Commercial tools like DebugBear, GTmetrix, or Calibre
Why do page speed tools throttle the network connection?
Web performance tests are often run on a computer with a fast network connection, for example in a data center or on a wifi connection. Page speed testing tools slow down the network in order to better show how a real user might experience a website, for example if a user is on a slow mobile connection.
Network throttling also ensures that metrics are more consistent, as the same network speed is used to run every test.
What is simulated throttling?
There are several different ways to slow down the network. Simulated throttling is one of them, and it's what Lighthouse uses by default.
With simulated throttling the initial site speed data is collected on a fast connection. Based on this data Lighthouse then estimates how quickly the page would have loaded on a different connection.
For example, if a page takes 2 seconds to render on a fast connection, Lighthouse might report a value of 6 seconds on a mobile device.
Simulated throttling provides low variability and makes tests quick and cheap to run. However, it can also lead to inaccuracies as Lighthouse doesn't fully replicate all browser features and network behaviors.
Check out this article for an in-depth look at how simulated throttling works in Lighthouse.
What tools use simulated throttling?
Simulated throttling is the default for Lighthouse, but Lighthouse also supports other throttling methods.
The lab diagnostics on PageSpeed Insights always use simulated throttling. The Chrome DevTools Lighthouse tab and the Lighthouse command line interface (CLI) use simulated throttling by default but also provide alternative options.
Dedicated commercial performance testing tools like DebugBear or WebPageTest solutions generally don't use simulated throttling.
PageSpeed Insights provides both lab data collected using Lighthouse and real-user data from the Chrome User Experience Report. Real-user data does not use any type of artificial throttling.
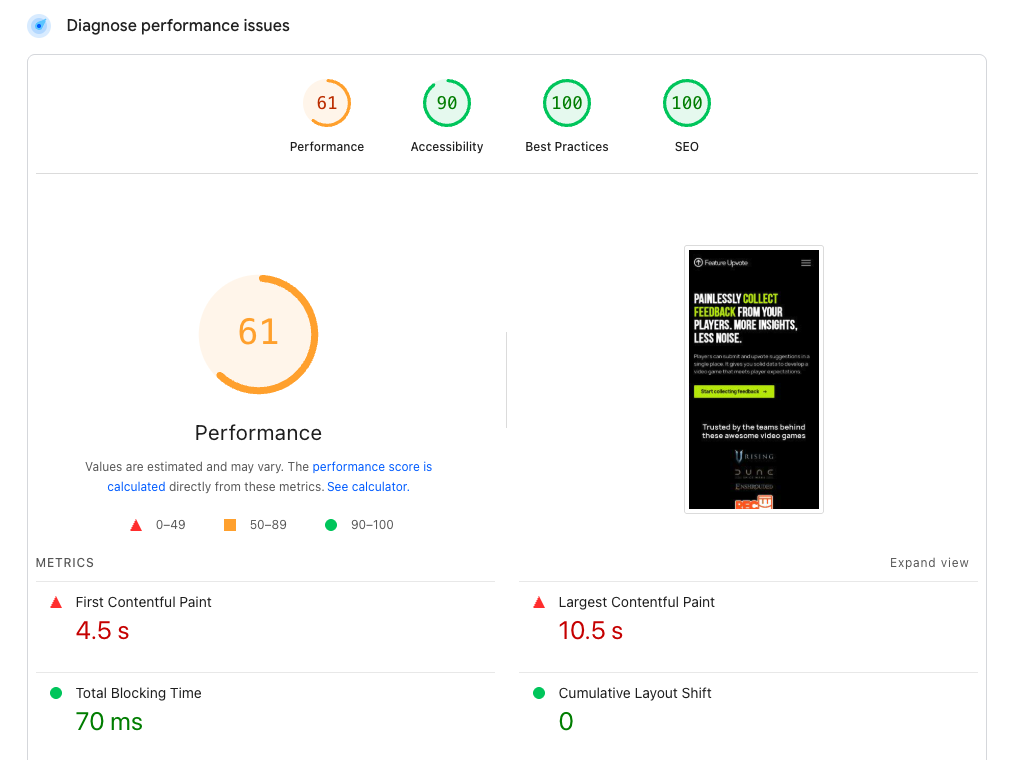
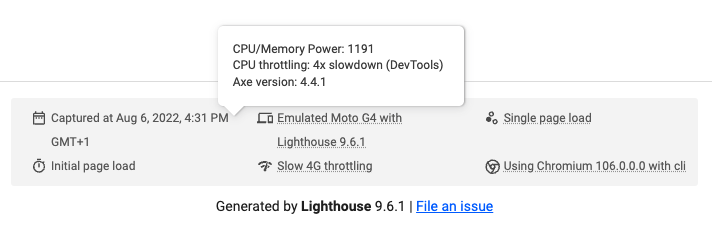
How can I tell what throttling method is used to run a test?
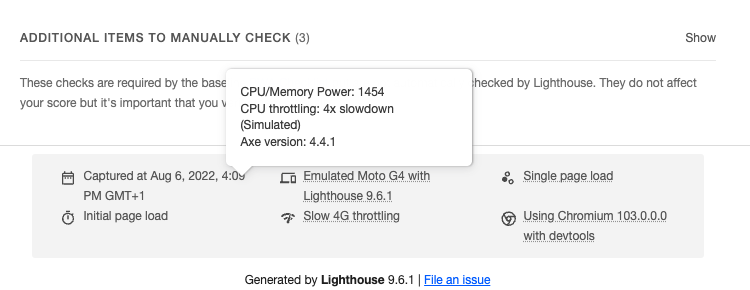
The bottom of the full Lighthouse report shows the test settings used to test the page. Hover over the network throttling details to see what type of throttling was used.
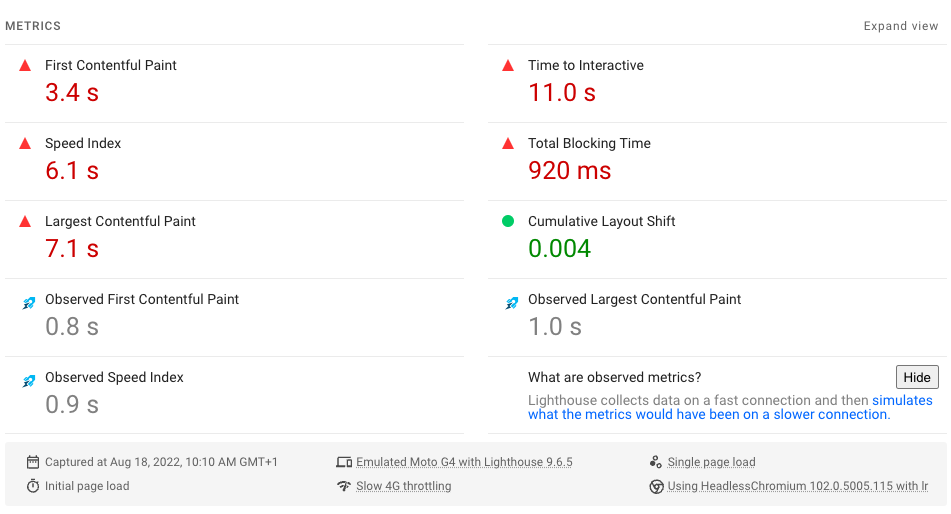
What are observed metrics?
Observed metrics are real measurements that were collected by Chrome. When simulated throttling is not used these values are equal to the final values reported by Lighthouse.
When simulated throttling is used then the reported values are generally worse than the observed values, as a slower connection is simulated. If the reported values are better than the observed values this usually indicates an inaccuracy in the throttling simulation.
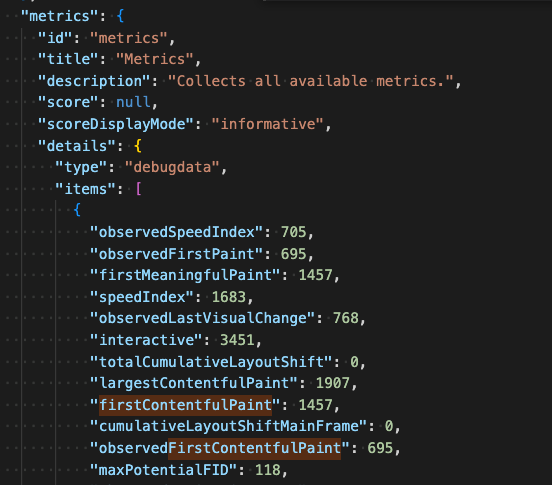
You can find the observed value in the full Lighthouse report JSON. In this example:
- Lighthouse measured a First Contentful Paint score of 695 milliseconds.
- After running the simulation, the reported value was 1,457 milliseconds.
For PageSpeed Insights, our Site Speed Chrome extension surfaces the observed metrics in the UI.
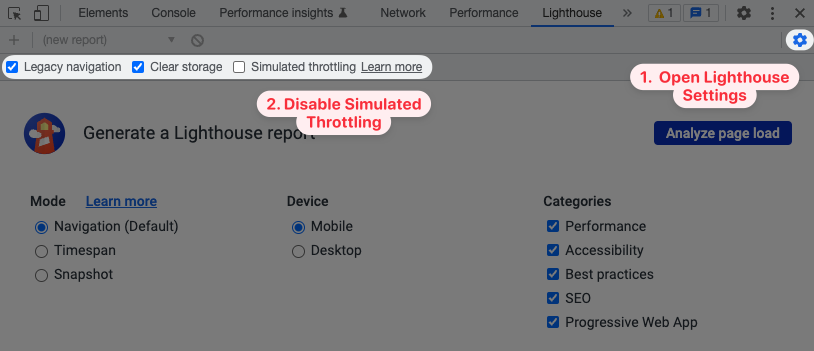
How do I disable simulated throttling in Chrome DevTools?
You can change the Lighthouse settings in the DevTools Lighthouse tab to throttle the network while the test is running.
- Click the gear icon in the top right of the Lighthouse tab – you will see two gear icons, make sure not to click the one for general DevTools settings!
- Untick Simulate throttling
Chrome will now use DevTools throttling to run the test. However, keep in mind that DevTools throttling comes with its own set of issues.
How do I disable simulated throttling with the Lighthouse CLI?
The Lighthouse command-line interface (CLI) provides a --throttling-method flag to control how data is collected.
You can set the flag to devtools to use the DevTools throttling discussed above.
lighthouse --throttling-method=devtools --view http://example.com
Throttling method: provided
The provided throttling method disables all network and CPU throttling.
lighthouse --throttling-method=provided --view http://example.com
Why is this method called provided? Because the Lighthouse test is still subject to the general network conditions of the computer the test is running on.
For example, you can throttle the network on your computer using the throttle tool by sitespeed.io. This type of packet-level throttling is the most accurate way to get realistic site speed test data.
What else can I do to get accurate metrics?
Dedicated testing tools like DebugBear automatically use accurate throttling methods. Any site speed tools that don't throttle the network at all will also provide accurate data.
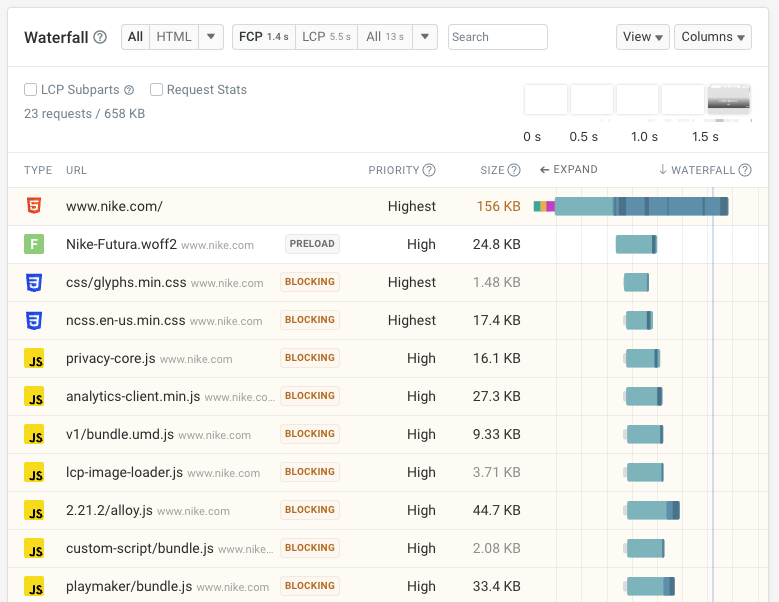
Simulated throttling does not provide per-request data, but tools that use a different approach can show a detailed request waterfall.
The waterfall chart can report in-depth request-level data, for example:
- How much time is spent establishing the server connection?
- When did individual response data chunks arrive in the browser?
- What was the request priority and response size?
Continuously collect high-quality data
DebugBear provides comprehensive web performance monitoring that covers both synthetic tests and real user analytics. The lab tests use packet-level throttling to make sure you can trust the metrics we report.
Get in-depth technical insights to speed up your website and receive alerts when there's a performance regression.
Real user monitoring makes it easy to identify slow pages across your website, and tells you how actual visitors experiences different pages.
You also get in-depth analytics for all three Core Web Vitals. Identify slow requests or specific scripts that impact user experience. Get started with a free 14-day trial.


Monitor Page Speed & Core Web Vitals
DebugBear monitoring includes:
- In-depth Page Speed Reports
- Automated Recommendations
- Real User Analytics Data