Measuring the Performance of User Journeys
This article explains how to use DebugBear to measure the performance of user scenarios following the initial page load.
Two types of user flows
There are two ways to script user interactions on DebugBear:
- Run JavaScript on the page (for example to open a modal or navigate in a single-page app)
- Use the setup flows feature to script a series of steps
If you run JavaScript as part of the full page test, you'll get a more detailed report including detailed performance metrics and accessibility and SEO scores. This only works for single-page applications.
If you use the user flows feature you can script multi-page user journeys and measure load time for each page. You can also measure Interaction to Next Paint (INP) scores for each interaction.
On-page JavaScript interactions
Script a user interaction and capture custom performance metrics
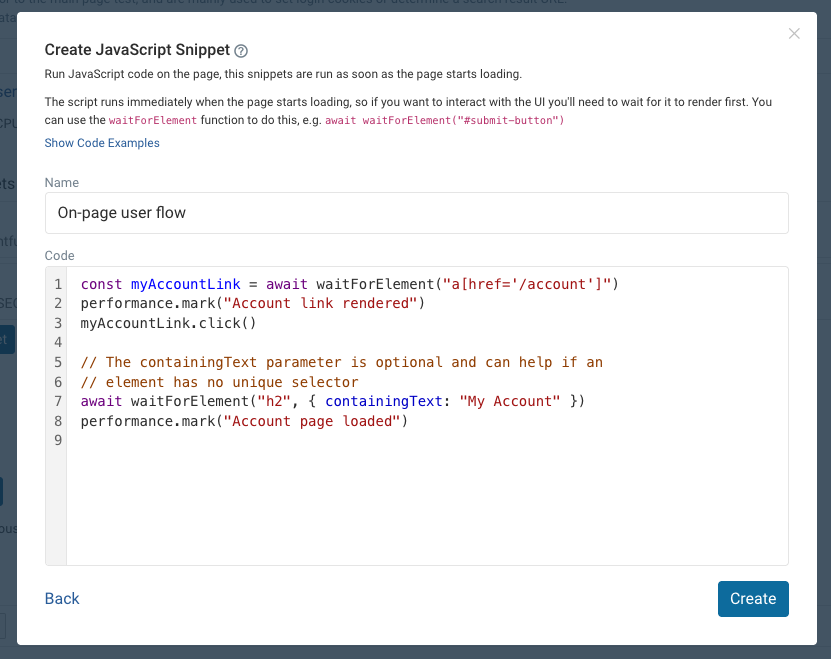
To script user journeys you need to run JavaScript code on the page. This code behaves similarly to code pasted into the DevTools console.
This example code clicks on a button that opens a modal.
const btn = await waitForElement("button.open-modal");
performance.mark("Button rendered");
btn.click();

await waitForElement("div.modal");
performance.mark("Modal rendered");
Use the waitForElement helper function to wait for DOM elements before clicking them or saving a custom timing metric. Paste this file in the console when testing user journeys in the browser DevTools.
You can use performance.mark to capture custom performance metrics. These metrics will be included in the DebugBear report.
Scripting form input
Just like before you can script form input using standard JavaScript.
const form = await waitForElement("#add-todo");
form.querySelector("input[name='title']").value = "Clean kitchen";
form.querySelector("input[type='button']").click();
await waitForElement(".todoCreatedMessage");
In a JavaScript app this sometimes won't be enough, as just updating the field value will not trigger the event listener for the form field.
Manually triggering the event can resolve this:
form.querySelector("input[name='title']").value = "Clean kitchen";
// Trigger keyup
form
  .querySelector("input[name='title']")
  .dispatchEvent(new Event("keyup", { bubbles: true }));
// Trigger change
form
  .querySelector("input[name='title']")
  .dispatchEvent(new Event("change", { bubbles: true }));
// (You'll need to trigger the right event for your app)
An example user journey
This example shows how to navigate between pages on Khan Academy.
// delay
const delay = (ms) => new Promise((res) => setTimeout(res, ms));
// Wait for page
await waitForElement("body");
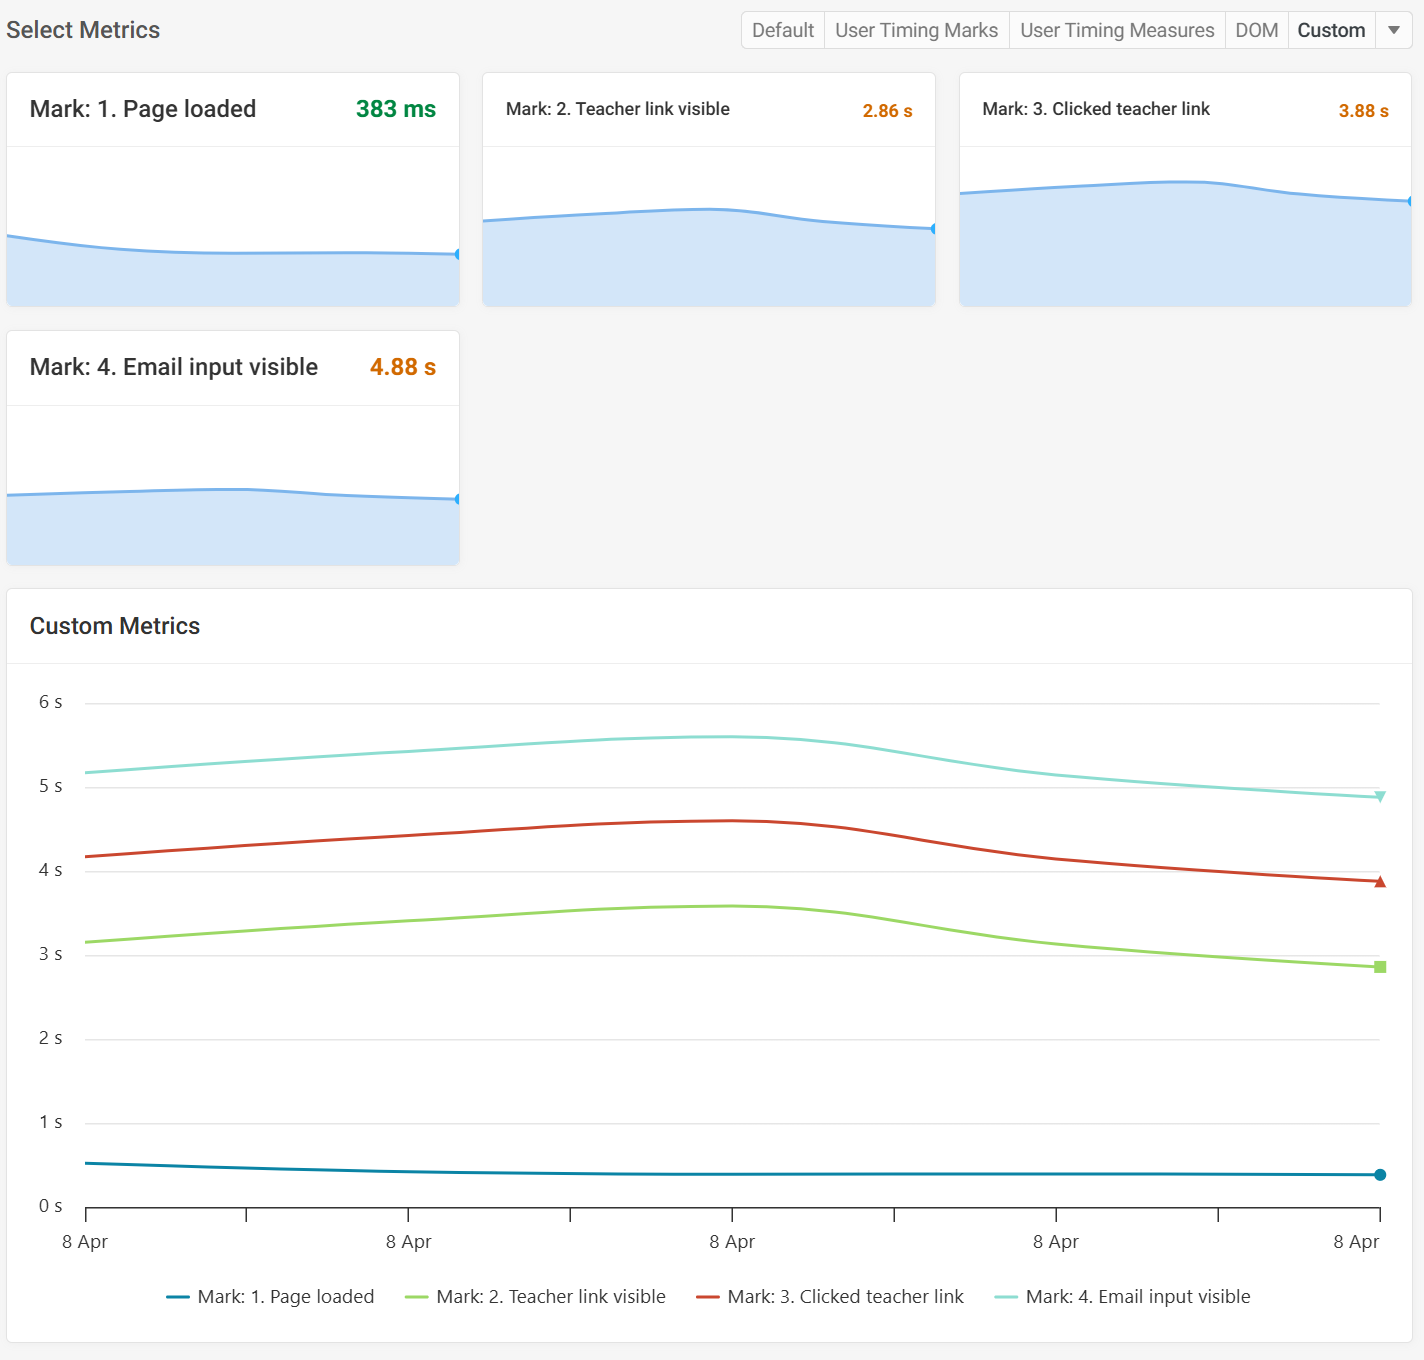
performance.mark("1. Page loaded");
await delay(1000);
// Wait for "I'm a teacher" link
const teacherLink = await waitForElement('a[href="/lohp/teacher"]');
performance.mark("2. Teacher link visible");
await delay(1000);
// Click link
teacherLink.click();
performance.mark("3. Clicked teacher link");
await delay(1000);
// Wait for email input
const emailInput = await waitForElement('input[type="email"]');
performance.mark("4. Email input visible");
await delay(1000);
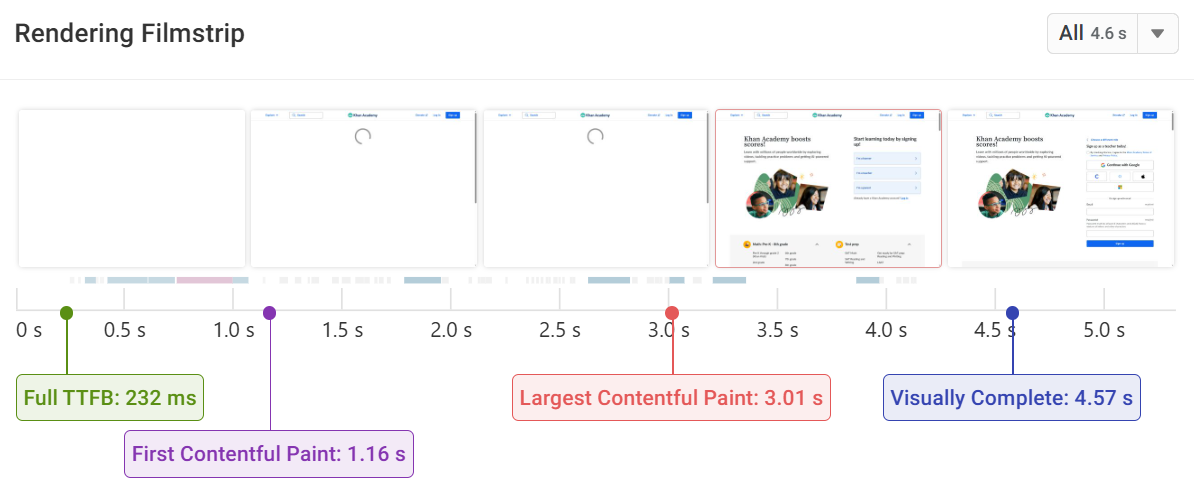
The script includes delays. Normally you won't need these, but I added them so each fully rendered page shows up in the filmstrip.
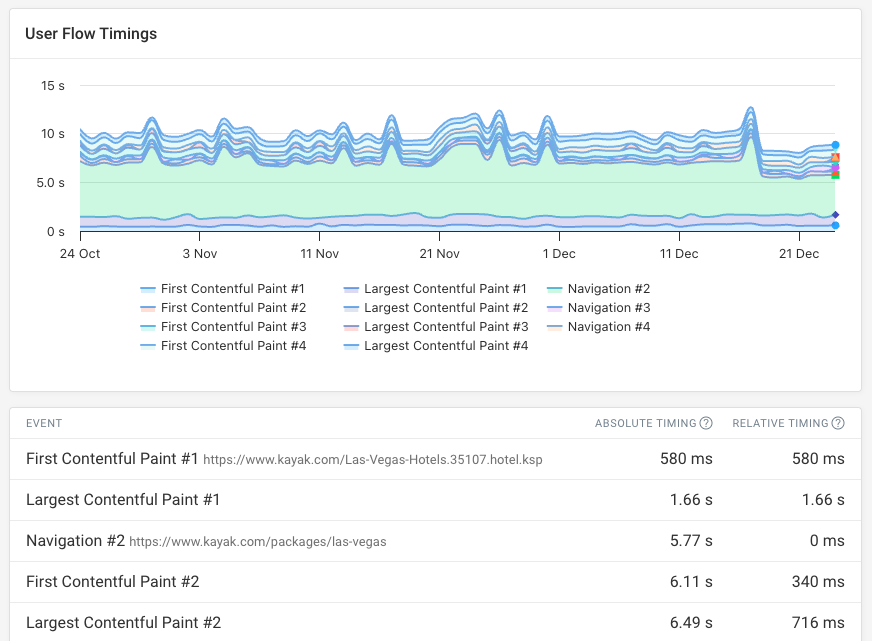
The Metrics tab lets you compare the User Timings in a single chart.
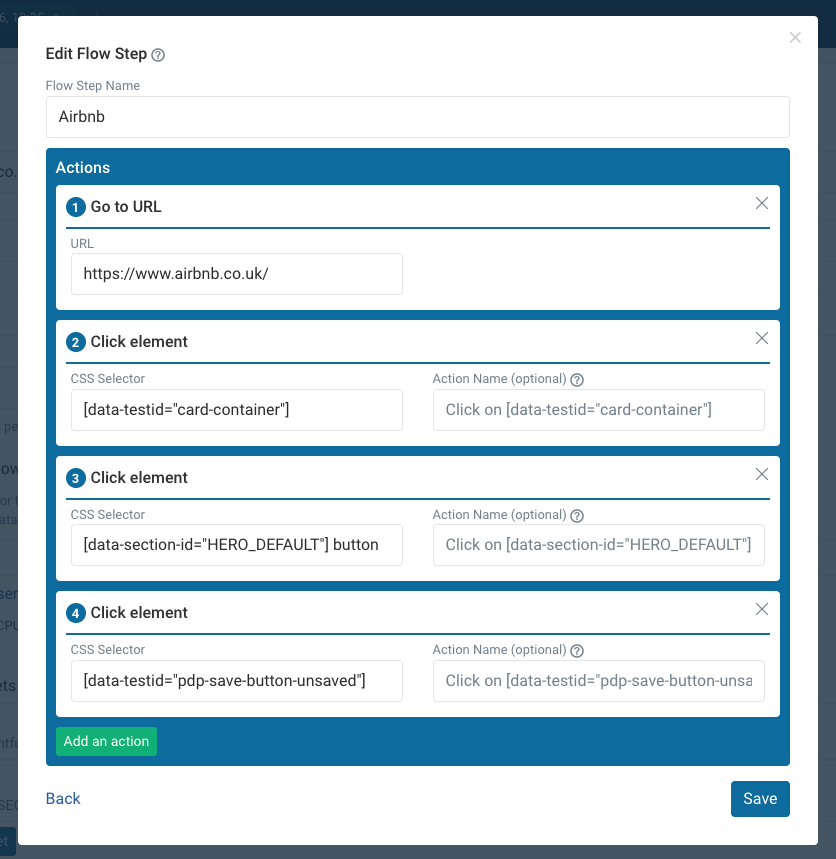
Scripting multi-page user flows
You can script custom user journey flows in the page advanced settings.
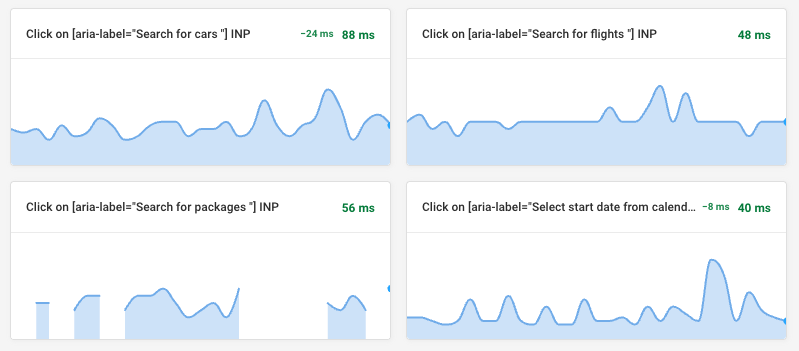
You can then view each navigation that occurred in the User Flow tab.
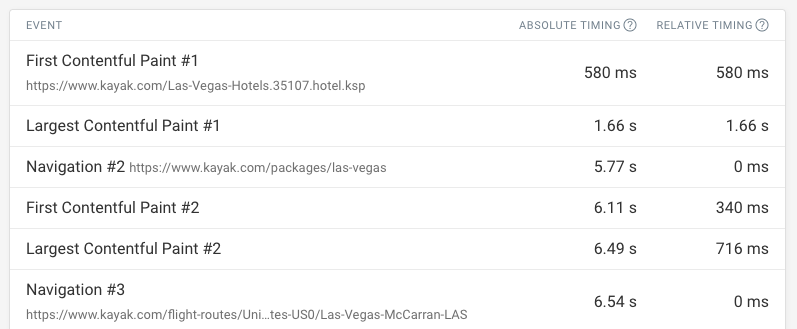
The tab also shows Interaction to Next Paint (INP) scores for each script interaction, like a click or keyboard input.