Core Web Vitals Metrics And Thresholds
Google has defined the Core Web Vitals metrics to help marketing and development teams optimize the user experience and performance of their websites.
These metrics show you how well-optimized your website is, and they are also used as a search engine ranking signal.
What are the Core Web Vitals metrics?
The three Core Web Vitals metrics are:
- Largest Contentful Paint (LCP): measures loading speed, specifically when the main page content renders
- Cumulative Layout Shift (CLS): measures visual stability
- Interaction to Next Paint (INP): measures responsiveness
The metrics Google uses to measure user experience change from time to time. For example the First Input Delay metric was retired in 2024.
Largest Contentful Paint
The Largest Contentful Paint metric measures how soon after opening a website the main page content shows up. It assesses the initial load experience and tells you how fast your website loads.
There are a number of factors that impact LCP, for example server response time, render-blocking resources, or image optimization.
Cumulative Layout Shift
A page with a poor Cumulative Layout Shift score has content that moves around after it first appears, rather than staying where it rendered. If the UI isn't stable after rendering this can be confusing for the visitor, and even lead to them interacting with the wrong page element accidentally.
Layout shifts can happen both during the initial page load and later on, whether after a timeout or in response to an interaction by a user.
Interaction to Next Paint
Interaction to Next Paint captures how quickly a page responds when visitors click, tap, or type. If an interaction requires a lot of processing it will temporarily freeze the page, delaying the next visual update.
Interactions generally happen after the initial load, once content is ready for the user to interact with.
What are the web vitals metric thresholds?
Google has defined rating thresholds for each of the Core Web Vitals metrics to help website owners understand their site performance and determine ranking impact.
Each metric value gets a rating of Good, Needs Improvement, or Poor.
| Metric | Good | Needs Improvement | Poor |
|---|---|---|---|
| Largest Contentful Paint | 2.5 seconds or less | 2.5 to 4 seconds | More than 4 seconds |
| Cumulative Layout Shift | 0.1 or less | 0.1 to 0.25 | More than 0.25 |
| Interaction to Next Paint | 200 milliseconds or less | 200 to 500 milliseconds | More than 500 milliseconds |
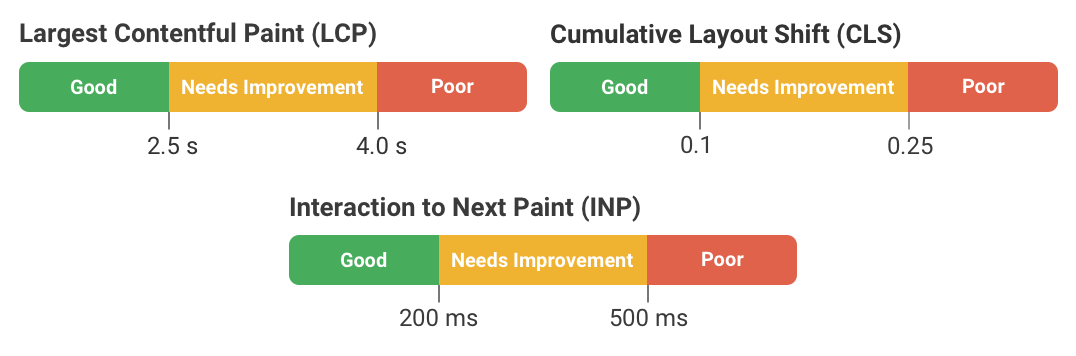
Google applies these thresholds to the 75th percentile of real user page loads, so 75% of visits need to fall in the Good range for a metric to pass. A page only passes the Core Web Vitals assessment if all three metrics are rated Good, and Google evaluates mobile and desktop separately.
How can I test the Core Web Vitals of my website?
There are several different ways to test your Core Web Vitals:
- Running a one-off test
- Monitoring Core Web Vitals
- Real user monitoring
Running a one-off test
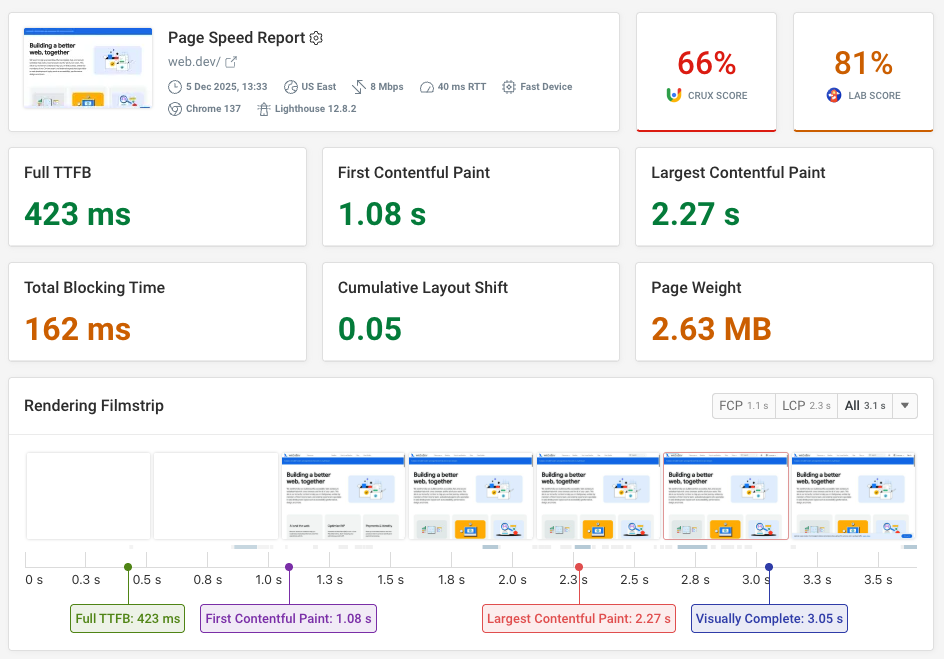
To get an initial evaluation of your Core Web Vitals you can run a website speed test using a tool like DebugBear or PageSpeed Insights.
This will check the Chrome User Experience Report (CrUX) data that Google uses as a ranking signal and run a Lighthouse test to generate diagnostic insights.
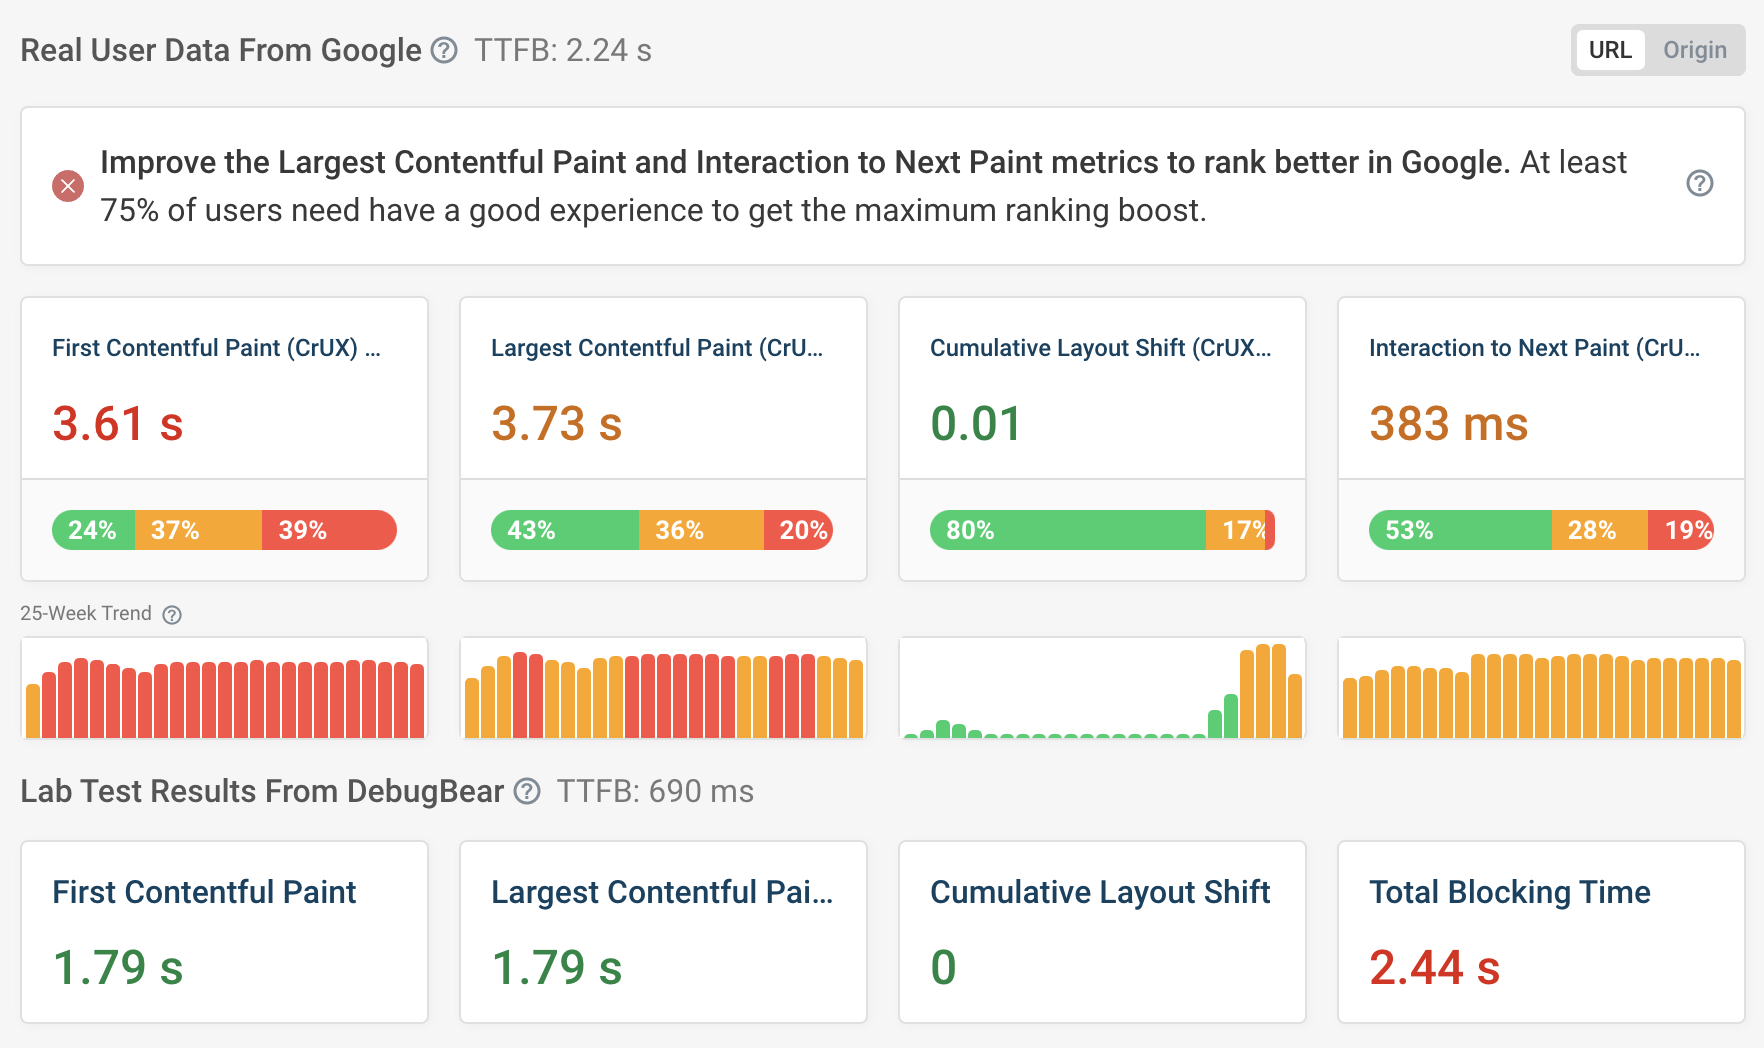
Our free Core Web Vitals test also provides additional data to help you speed up your website, like a detailed request waterfall and custom performance recommendations.
Run A Free Page Speed Test
Test Your Website:
- Automated Recommendations
- Detailed Request Waterfall
- Web Vitals Assessment
Monitoring Core Web Vitals
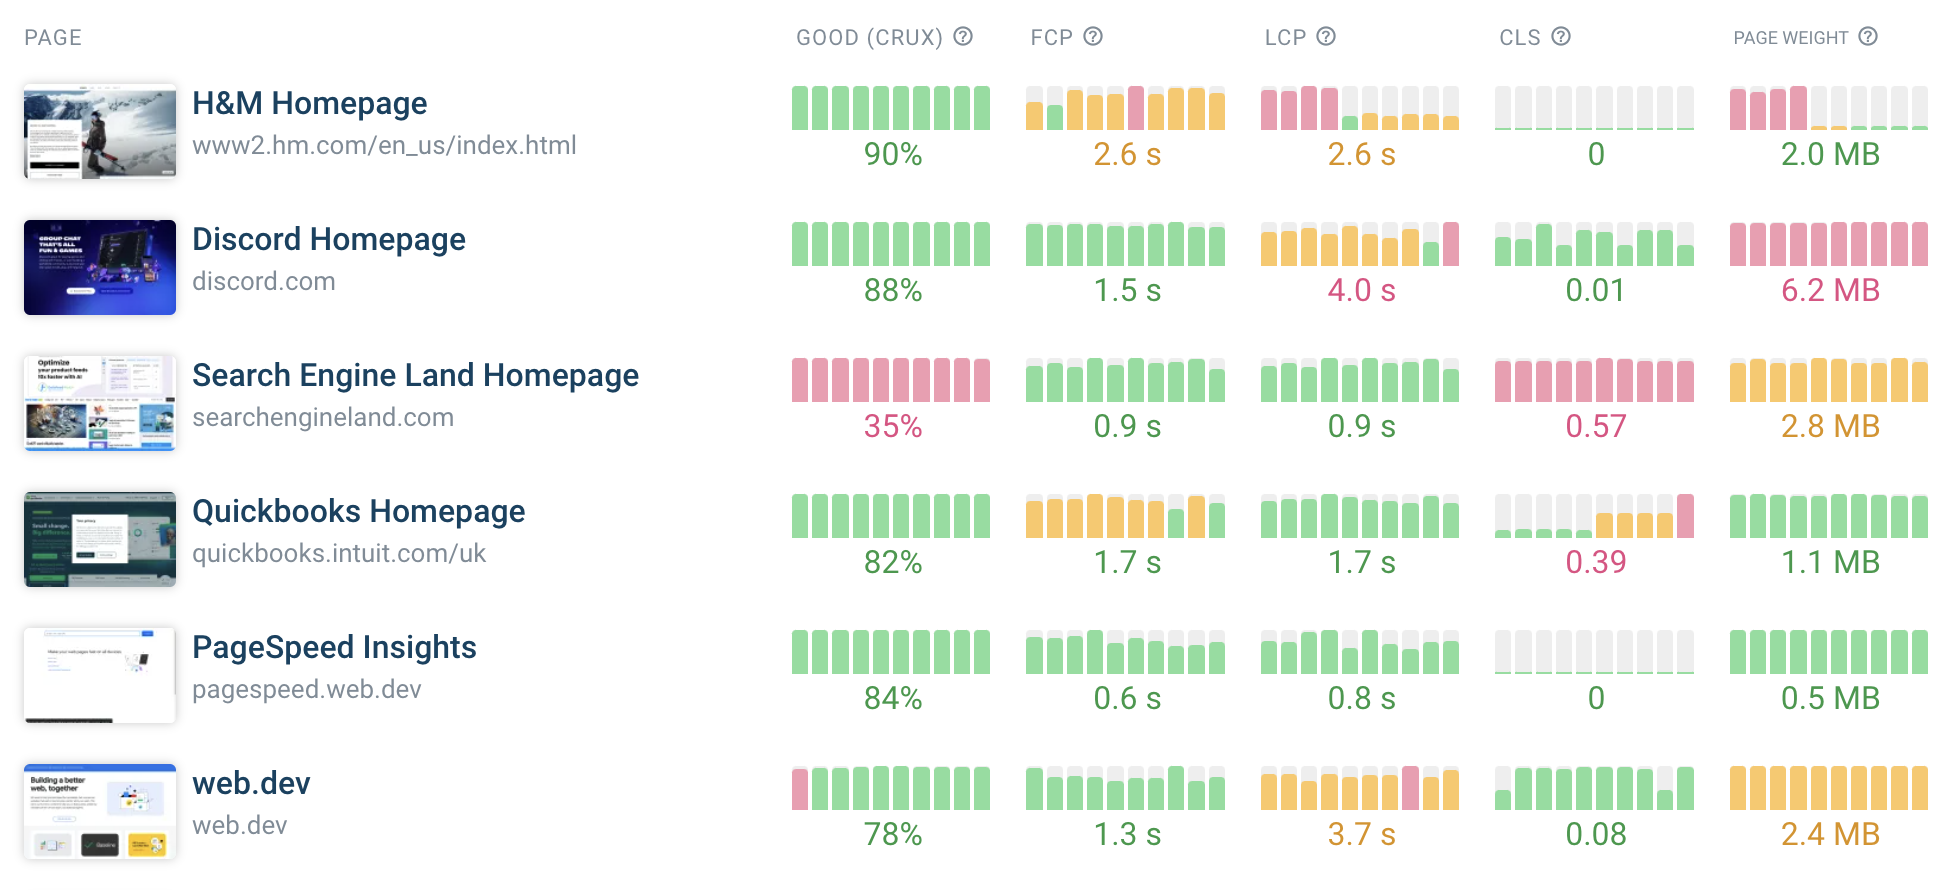
You need website performance monitoring if you want to improve your Core Web Vitals and keep passing the Core Web Vitals assessment over time. That way you can confirm that your changes are having a positive impact and get alerted when your performance is getting worse.
You can track the web vitals of your own website as well as those of your competitors, to see how fast your website is in comparison.
Real user monitoring
Getting set up with lab-based monitoring tools is easy: all you need to do is enter your website URL. But there are two key problems:
- You don't know how actual visitors experience your website
- Lab tests only measure Interaction to Next Paint for interactions they simulate, not the ones your visitors actually make
That's why you also need real user monitoring, which uses a small script on your website to collect data from real visits.
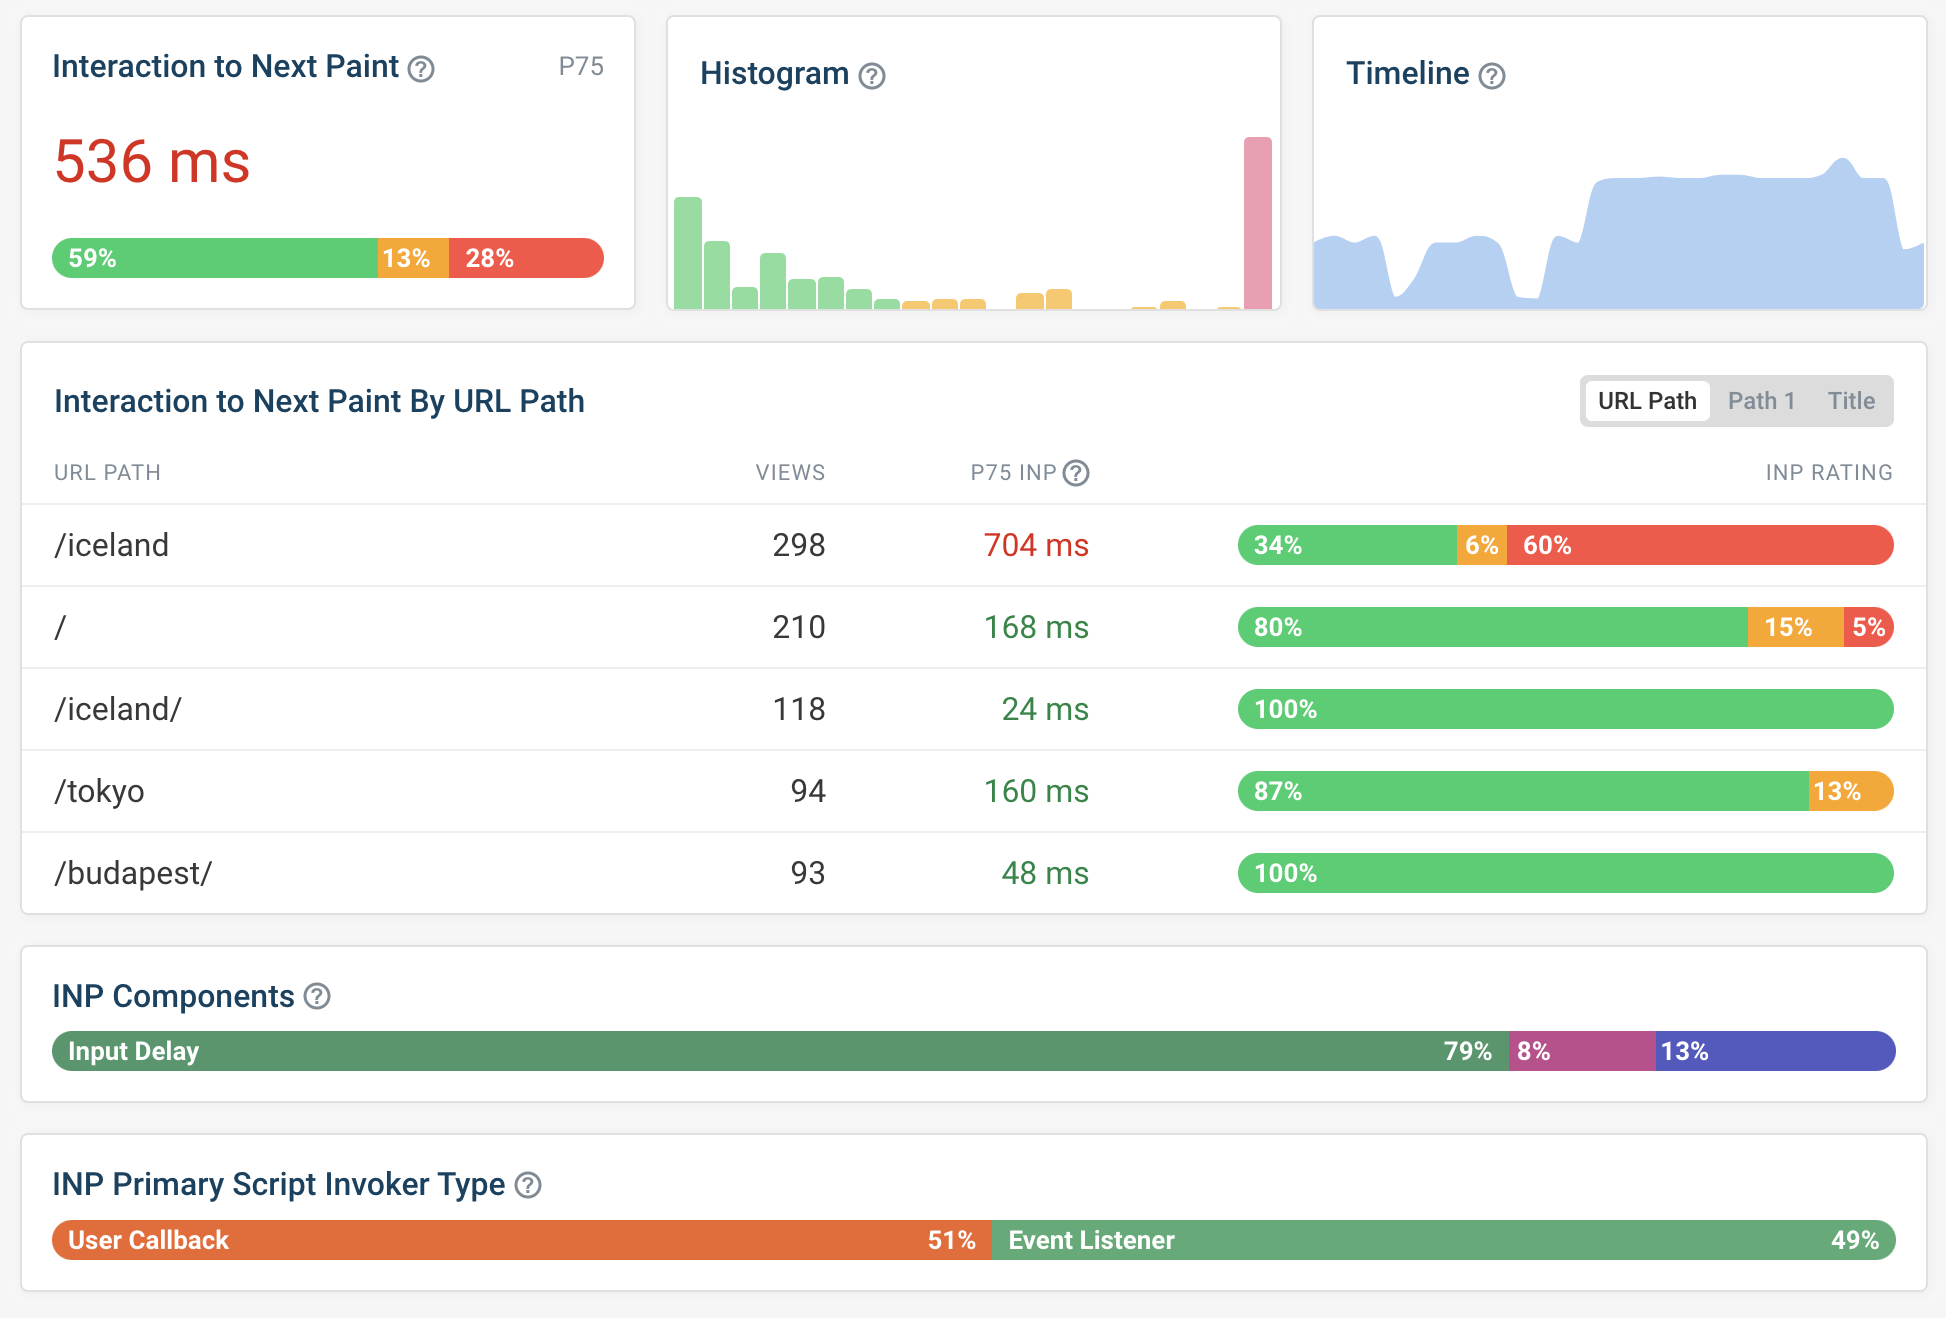
DebugBear provides in-depth monitoring to help you improve Interaction to Next Paint and other Core Web Vitals. For example, you can see what element interactions are slow or what scripts contribute to interaction delays.
Monitor Page Speed & Core Web Vitals
DebugBear monitoring includes:
- In-depth Page Speed Reports
- Automated Recommendations
- Real User Analytics Data