Additional RUM Metrics
Along with the main metrics featured in the RUM sidebar, DebugBear also provides more specific metrics such as the load event or component breakdowns of the Core Web Vitals.
Looking at more specific metrics can help make optimizing a particular metric easier. For example, taking a closer look at pages with high Input Delay can help you identify cases where background tasks contribute significantly to the overall INP score.
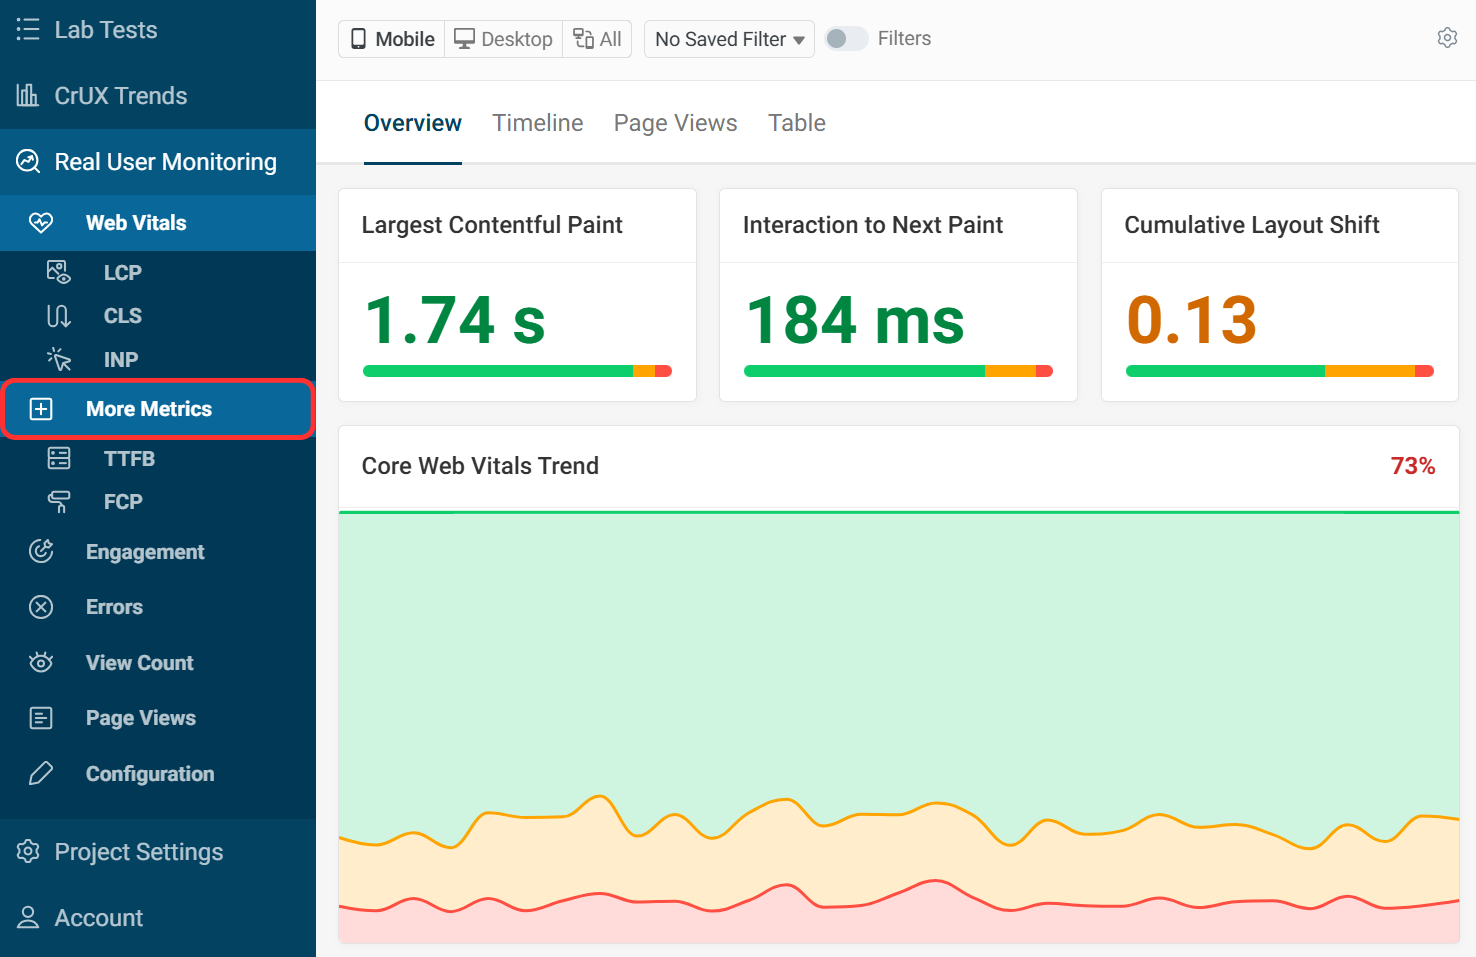
How to find additional RUM metrics
You can find additional metrics by clicking the More Metrics tab.
Clicking a metric will show its individual dashboard with the familiar tabs.
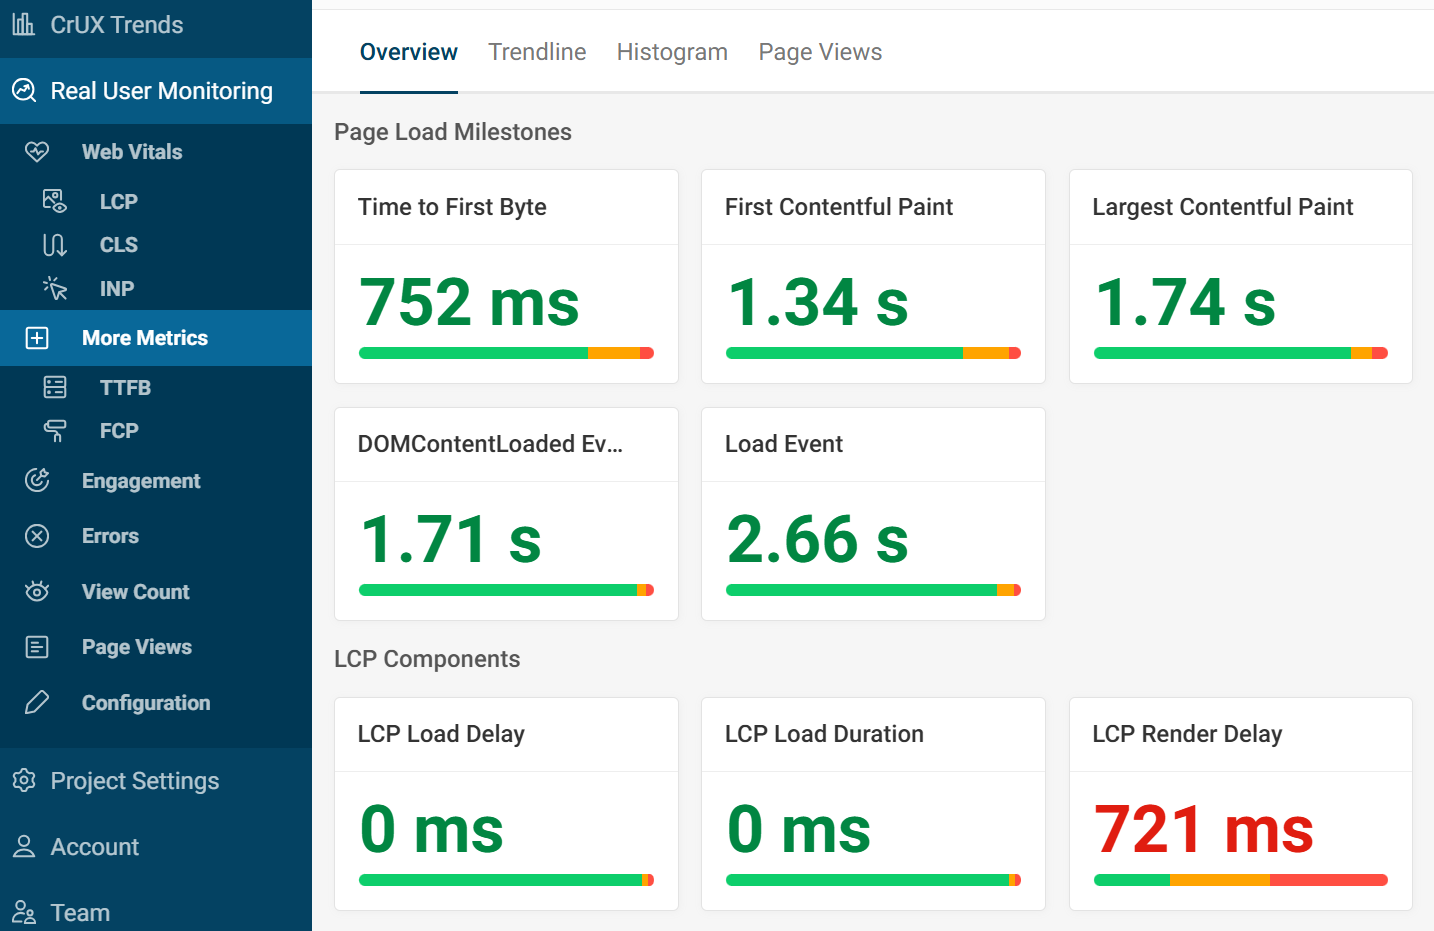
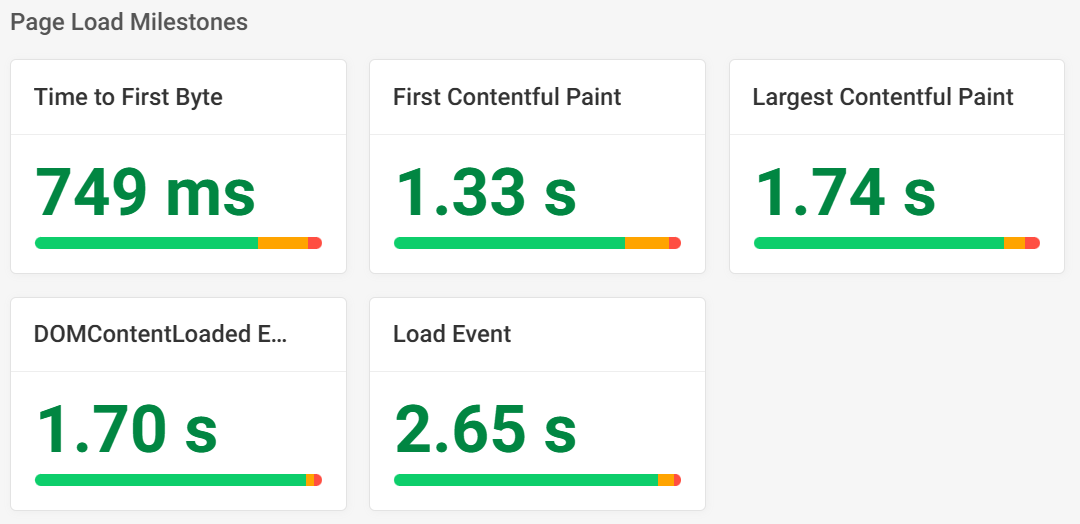
Rendering milestones
Time To First Byte, First Contentful Paint and Largest Contentful Paint have their own metric dashboards in the sidebar.
There are two additional rendering milestone metrics available in this section:
- DOMContentLoadedEvent: when the initial page HTML has been parsed
- Load Event: when the page has loaded, including any dependent resources such as scripts and images
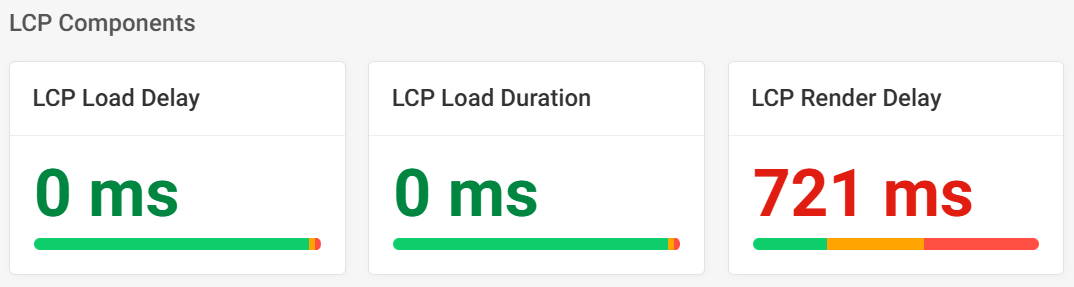
LCP Components
Largest Contentful Paint is made up of four sub-parts:
- Time To First Byte: time to start loading the HTML document from the website server
- LCP Resource Load Delay: time for the browser to discover the LCP image
- LCP Resource Load Time: time for the browser to download the LCP image
- LCP Render Delay: time for the browser to display the LCP image or other content element
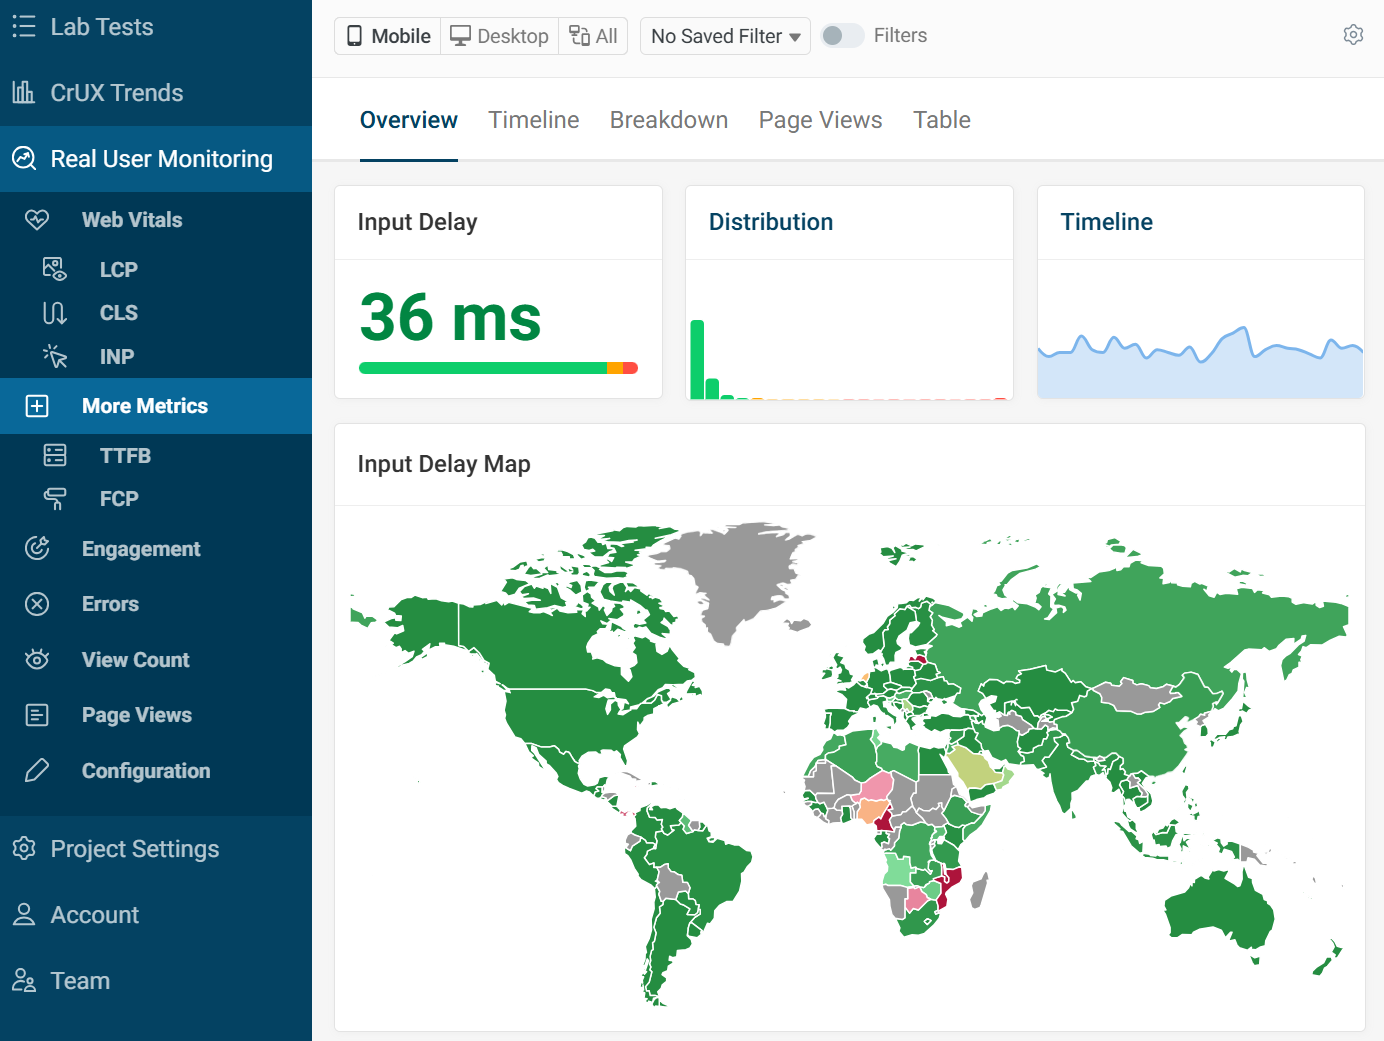
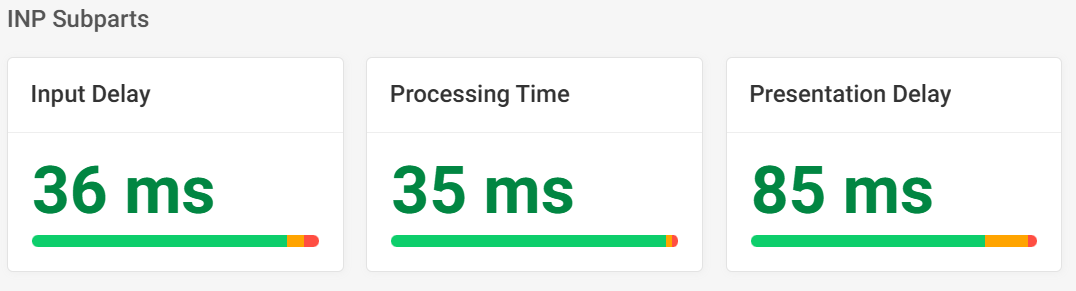
INP Subparts
Interaction to Next Paint is made up of three subparts:
- Input Delay: waiting for background tasks on the page that prevent the event handler from running
- Processing Time: running event handlers in JavaScript
- Presentation Delay: handling other queued up interactions, recalculating the page layout, and painting page content
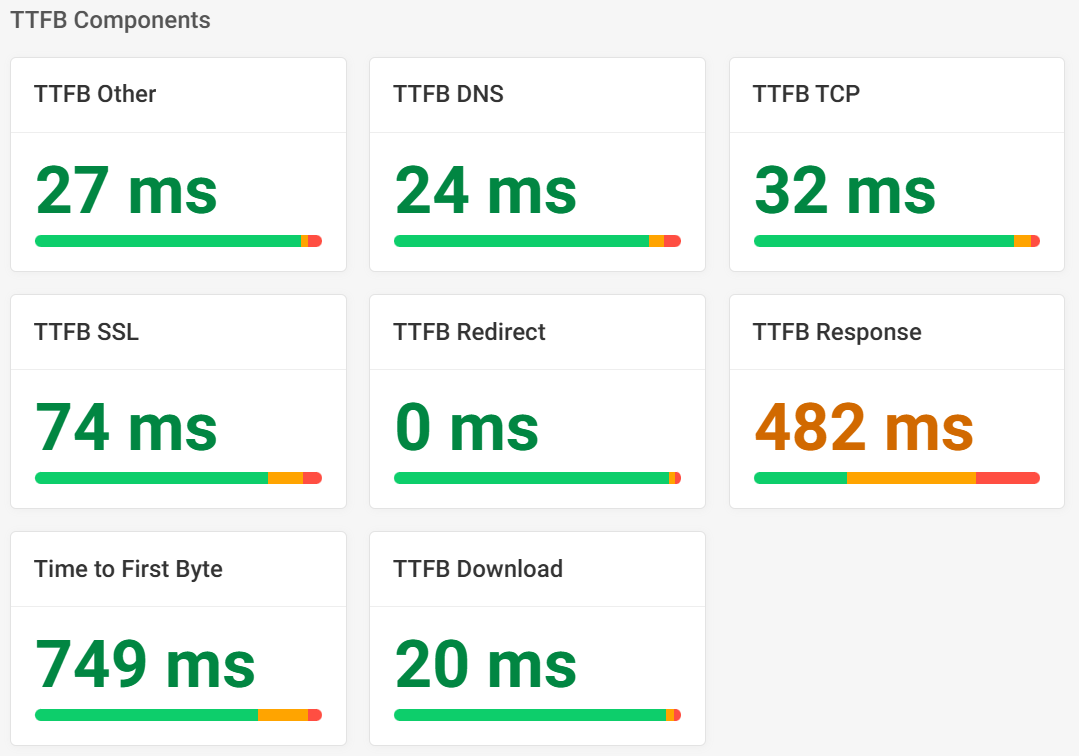
TTFB Components
Time to First Byte can be broken down into the following components:
- TTFB Redirect: time spent on same-origin redirects, for example if example.com/a returns a 301 status code and redirects to example.com/b
- TTFB Wait: various wait times, for example service worker processing or cross-origin redirects
- TTFB DNS: time spent looking up the IP address for the domain name
- TTFB TCP: time spent establishing a reliable connection
- TTFB SSL: time spent establishing a secure connection
- TTFB Response: time spent waiting for the server to respond with the HTML document content
- TTFB Download: time spent downloading the HTML document
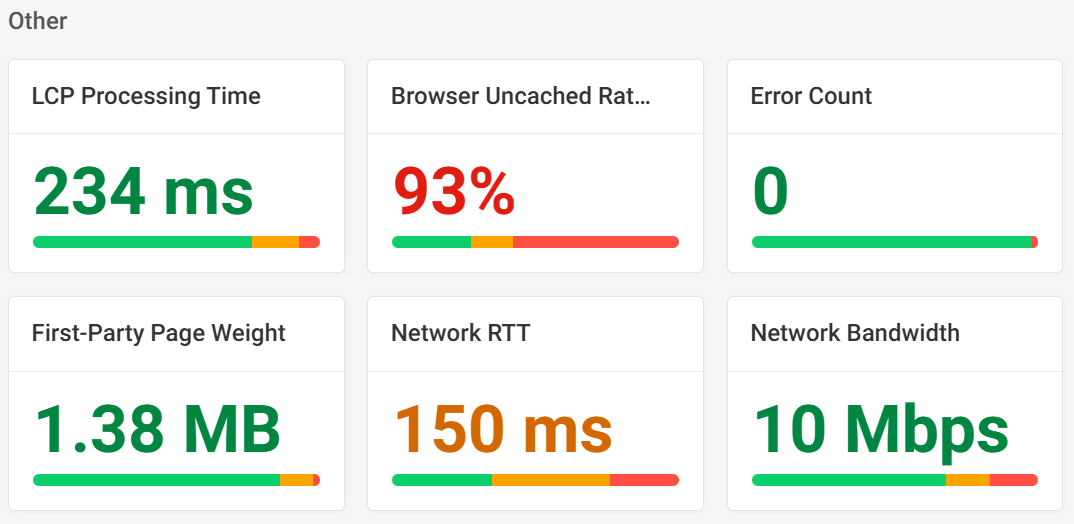
Other
- LCP Processing Time: Duration of CPU tasks prior to the LCP milestone.
- Browser Uncached Ratio: percentage of requests that were served from a server rather than the browser cache.
- Error Count: The number of unhandled errors and promise rejections that were recorded.
- First-Party Page Weight: Download size for first-party requests on the page.
- Network RTT: Rough round trip latency time estimate that the browser provides through the Network Information API.
- Network Bandwidth: Rough bandwidth estimate that the browser provides through the Network Information API.
This data can be useful to see if regressions can be caught over time and if extending cache duration can help.
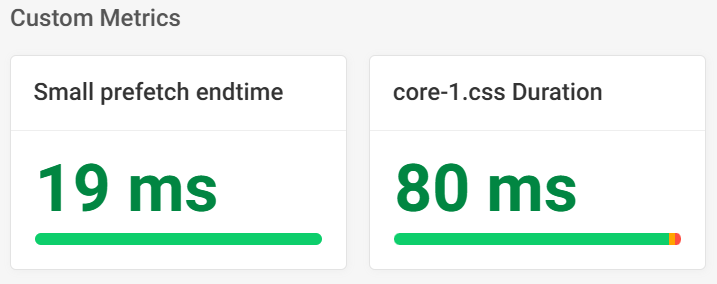
Custom Metrics
Custom Metrics can be setup to monitor performance related to your specific website. For example, you could create a custom metric to measure how fast a product image renders.