

Synthetic User Flow Monitoring
Monitor the steps your customers take, not just your landing page.
Track page speed and interaction delays across the whole flow.
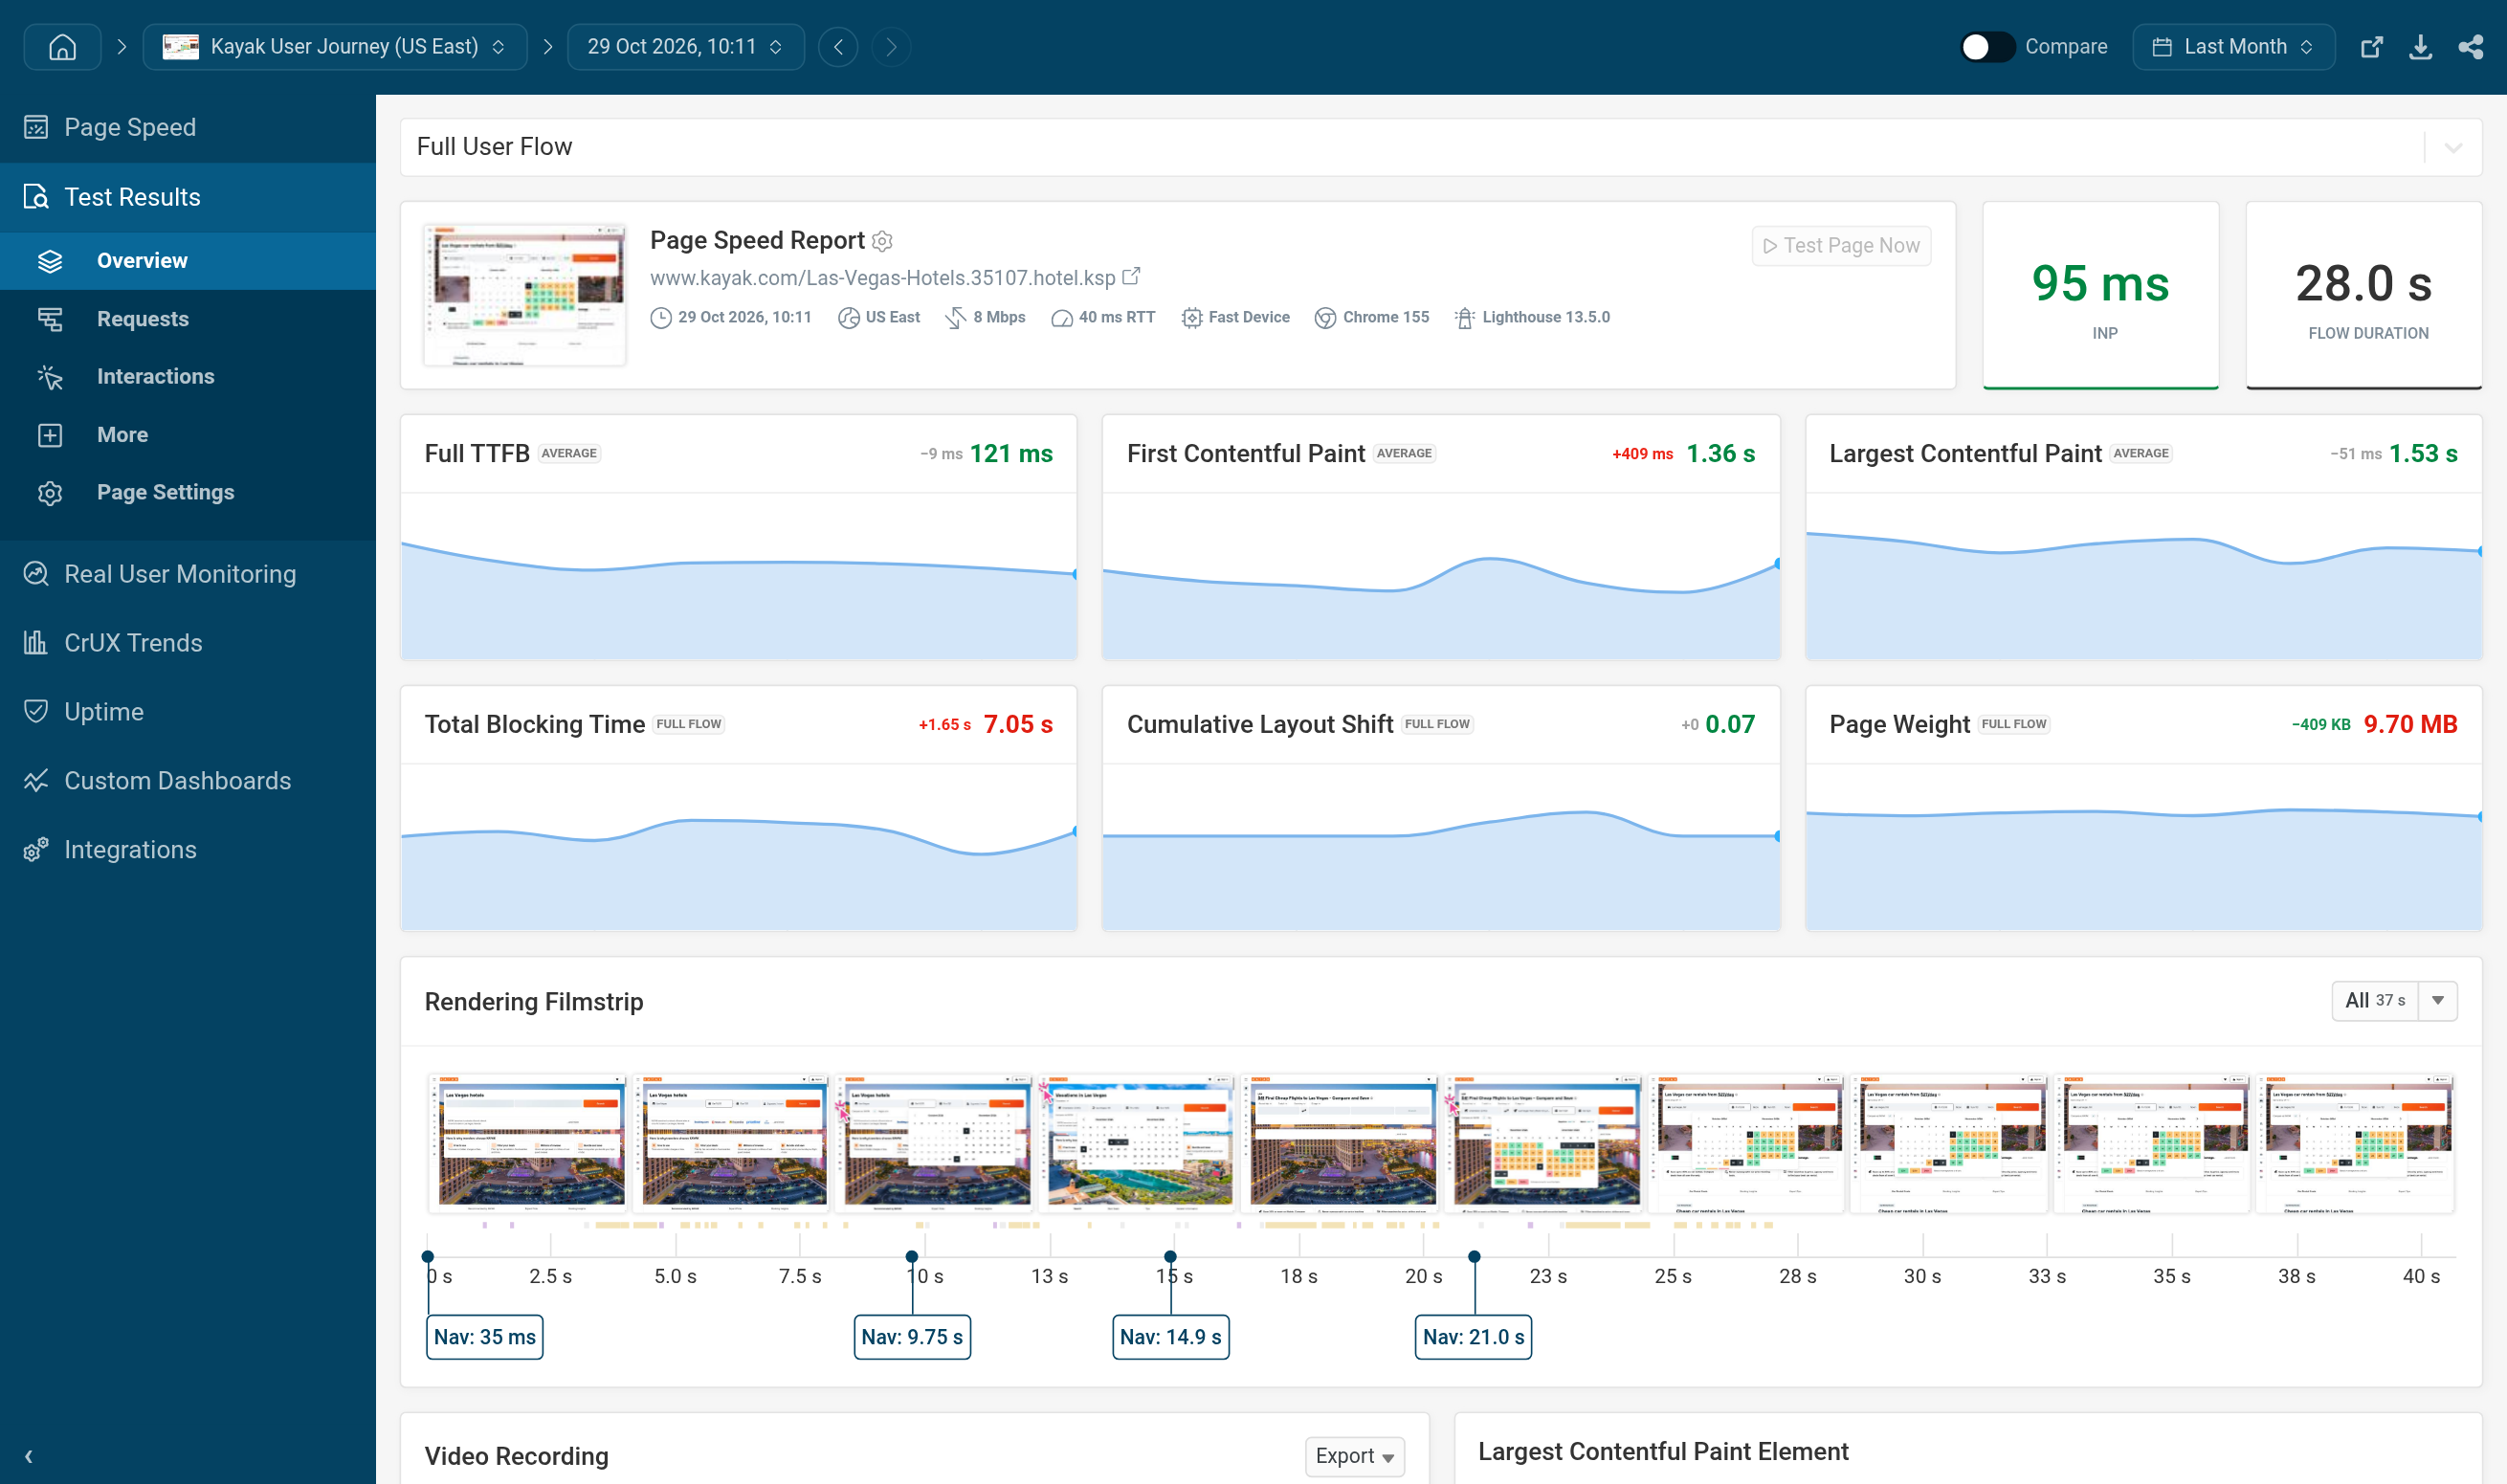
Monitor what your customers actually do
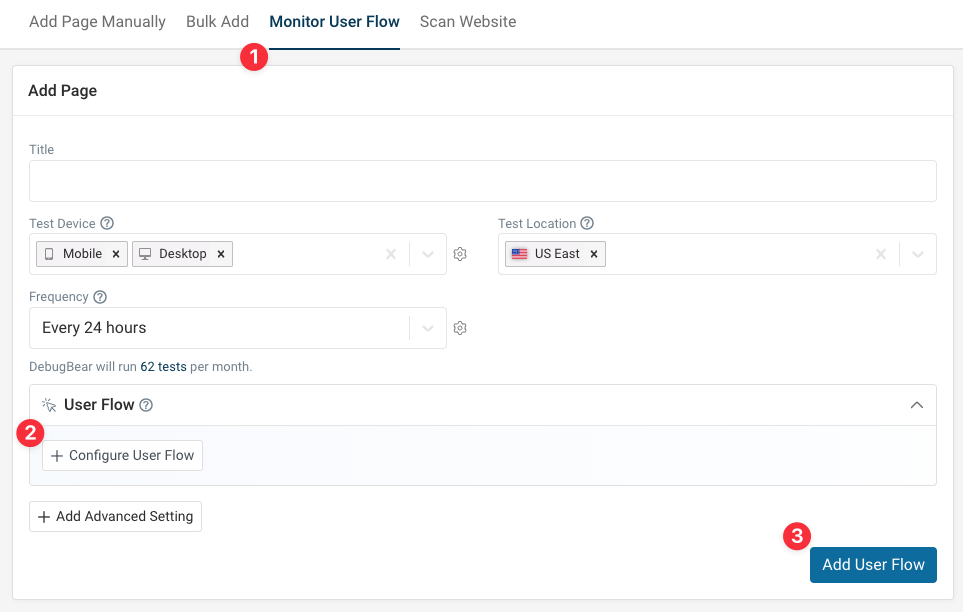
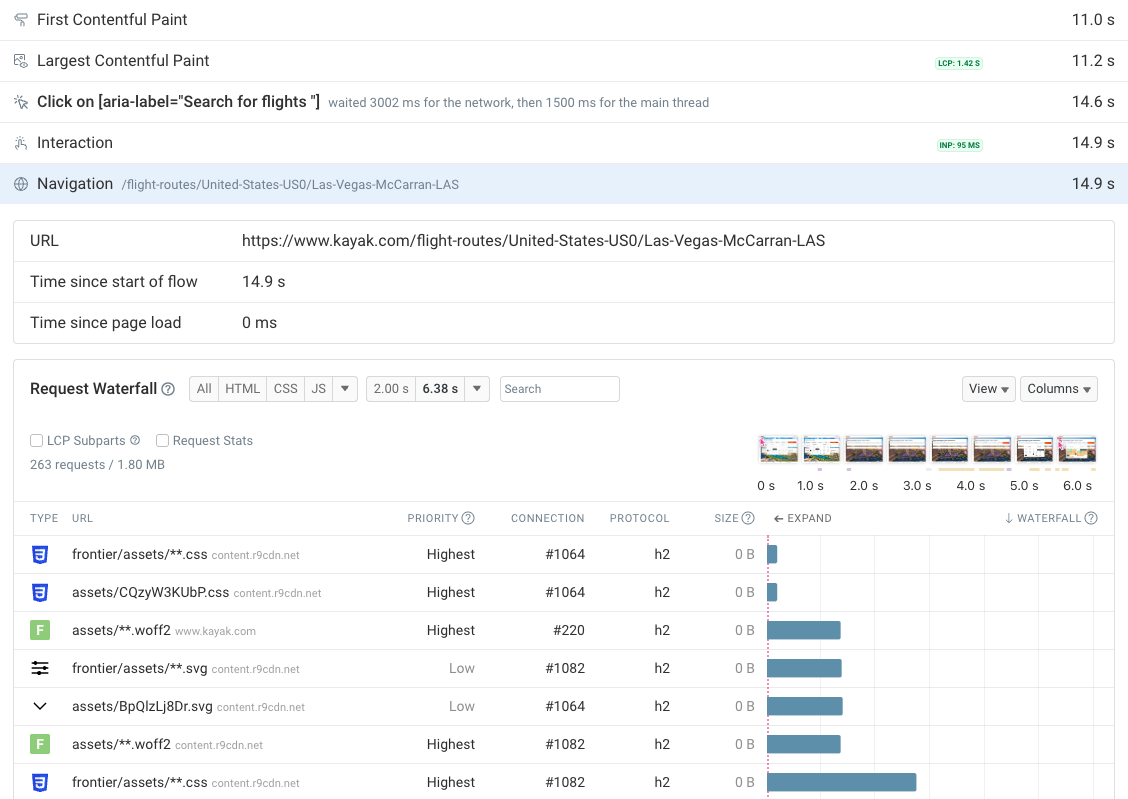
See where the time goes, step by step
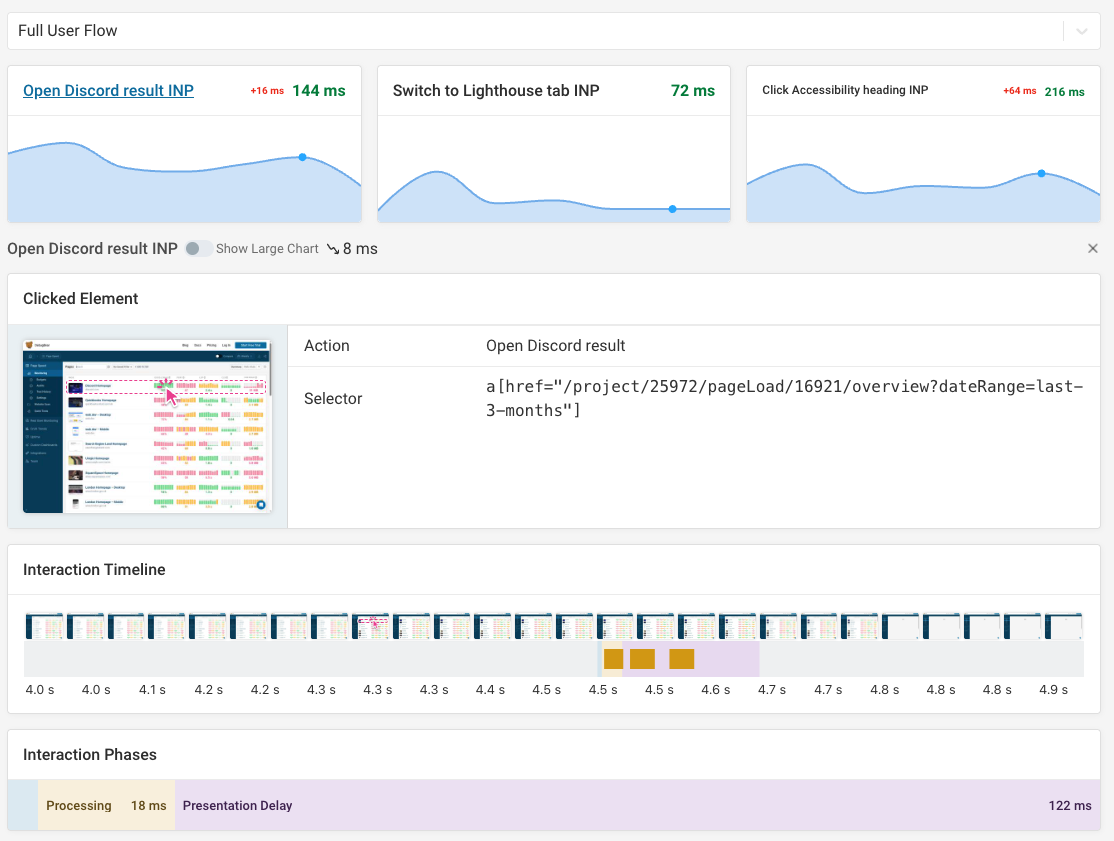
Measure interactions, not just page loads
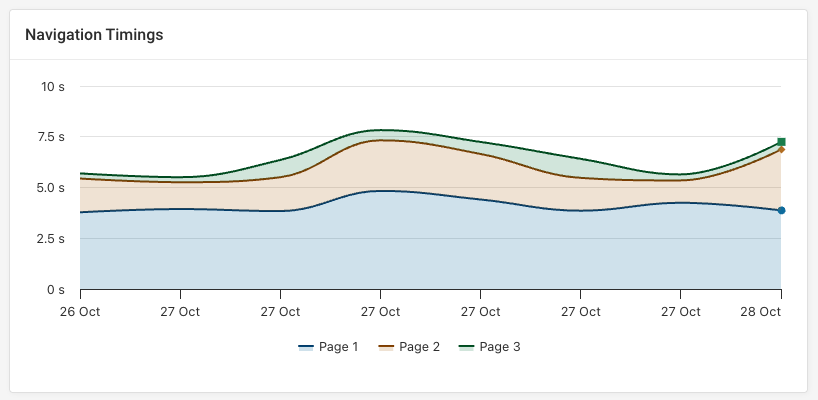
Watch each page of the flow over time
Hear from our users
“The most actionable-info packed page speed visualization
available. DebugBear provides unique features that are crucial
to debugging complex issues, like request-chain visualization.”


“The reporting data is very helpful in pinpointing what causes
site speed issues – immediately actionable.
It's well above and beyond the info you get from Lighthouse
and the performance tests through Chrome.”


“DebugBear delivers the
best stats for before and after changes
in exquisite detail. It also shows clear and easy to find data for
Google's Web Vitals.


“DebugBear's alerts are our early warning system. They catch new scripts that could slow us down before they become a problem.”


“We've used several performance monitoring tools, but
DebugBear is our favourite because of its clarity, reliability, and attention to Core Web Vitals.
We can easily find synthetic testing and real-user data in one place.


You are using an old browser that is not supported anymore. You can continue using the site, but some things might not work as expected.