
Pingdom is a website monitoring tool offering uptime monitoring, synthetic testing, and real user analytics. Having been launched over 20 years ago, Pingdom is an established player in the space.
However, there are many more modern Pingdom alternatives available in the market today. In this article we'll look at a few of them and see what they can offer.
Most Pingdom users need two things: to know when the site goes down and to know when it gets slow. Some of the tools below only cover one of those, so the pros and cons for each tool show which it covers.
DebugBear: Page speed, Core Web Vitals, and uptime monitoring
DebugBear covers the same ground as Pingdom, with uptime checks, synthetic page speed tests, and real user monitoring, but goes much deeper on web performance and Google Core Web Vitals.
The tool combines four types of monitoring data:
- Uptime monitoring with checks as often as every minute
- Synthetic monitoring with detailed page speed reports
- Real user monitoring with end user insights
- Google Chrome User Experience Report (CrUX) data for SEO impact
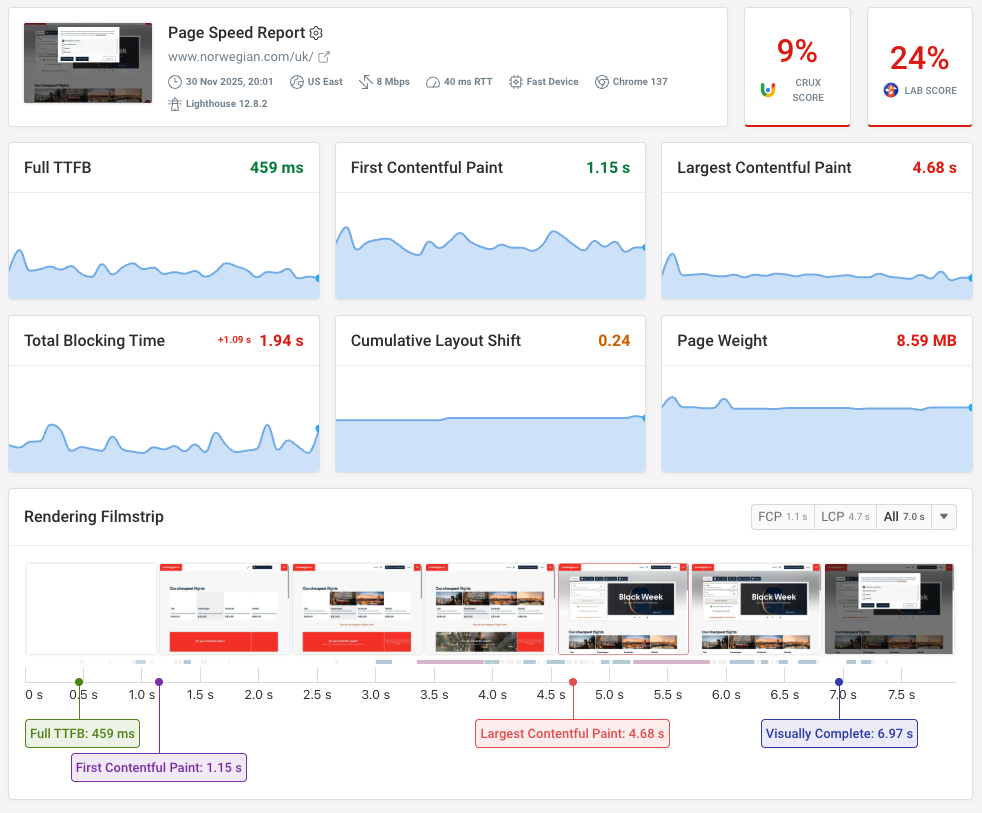
Here's an example of DebugBear's URL monitoring dashboard:
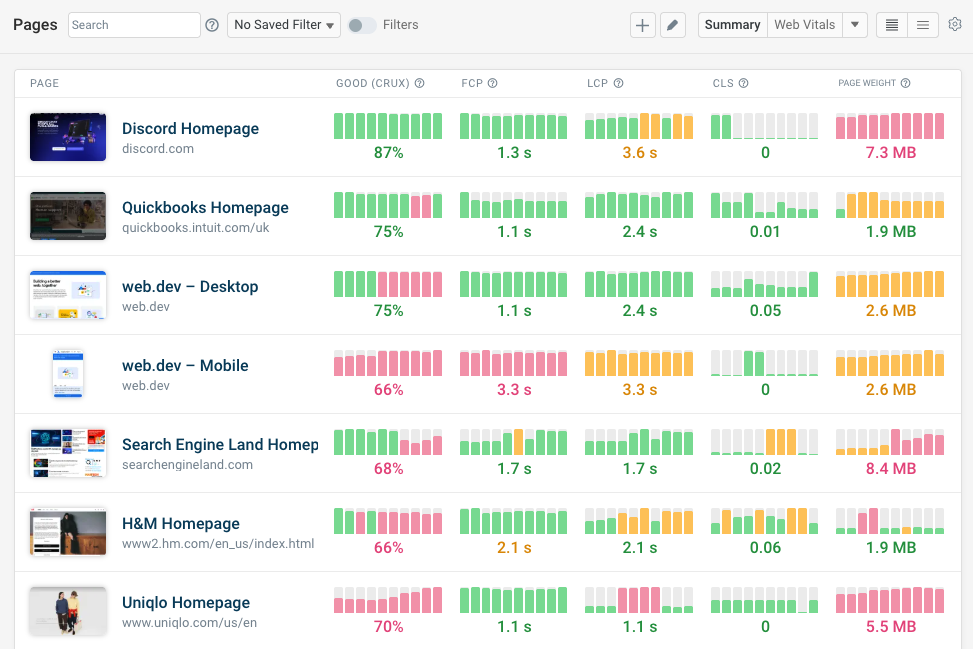
You can test your website across different devices from over 30 locations, and each result includes a detailed analysis of what's slowing the page down.
For example, you can investigate your page speed using:
- A detailed request waterfall
- A Largest Contentful Paint (LCP) subpart analysis
- Custom recommendations
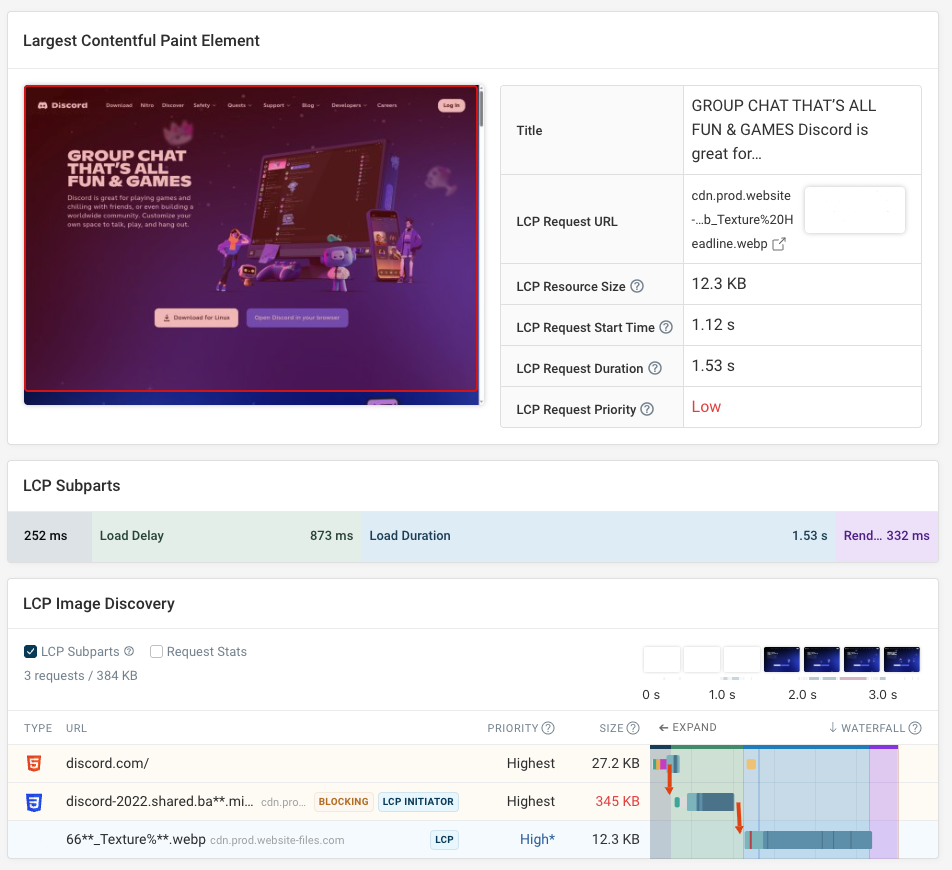
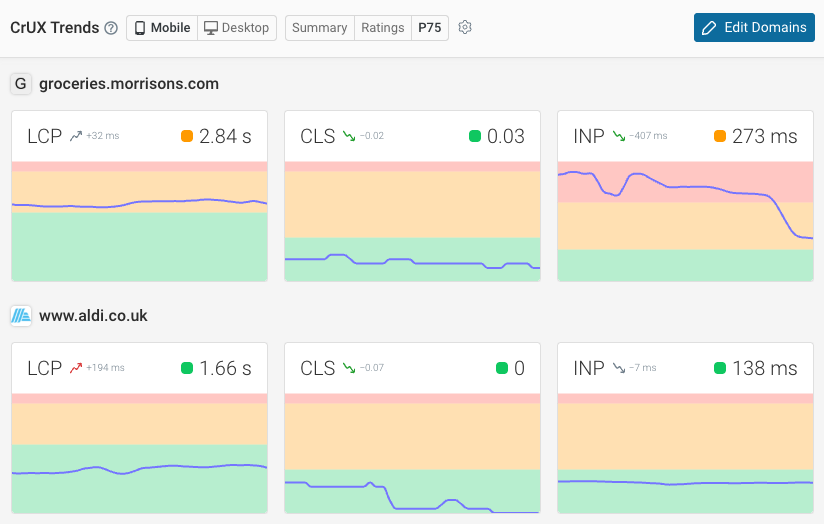
You can use the CrUX data to benchmark your website performance against competitors.
Having a faster website can help you rank higher in Google, as the Core Web Vitals metrics are a ranking factor.
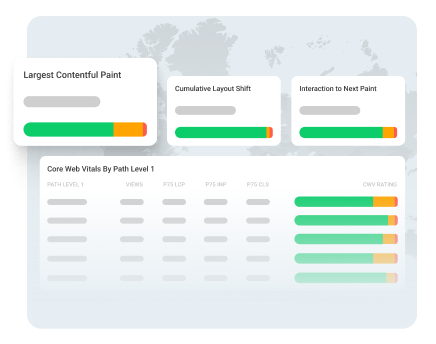
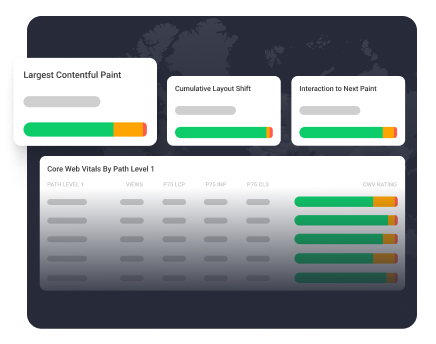
DebugBear's real user monitoring solution measures Core Web Vitals and other metrics across your whole website. You can break down page speed by device, country, browser, and other categories.
This dashboard shows an overview of the Interaction to Next Paint metric, including performance on the most visited pages.
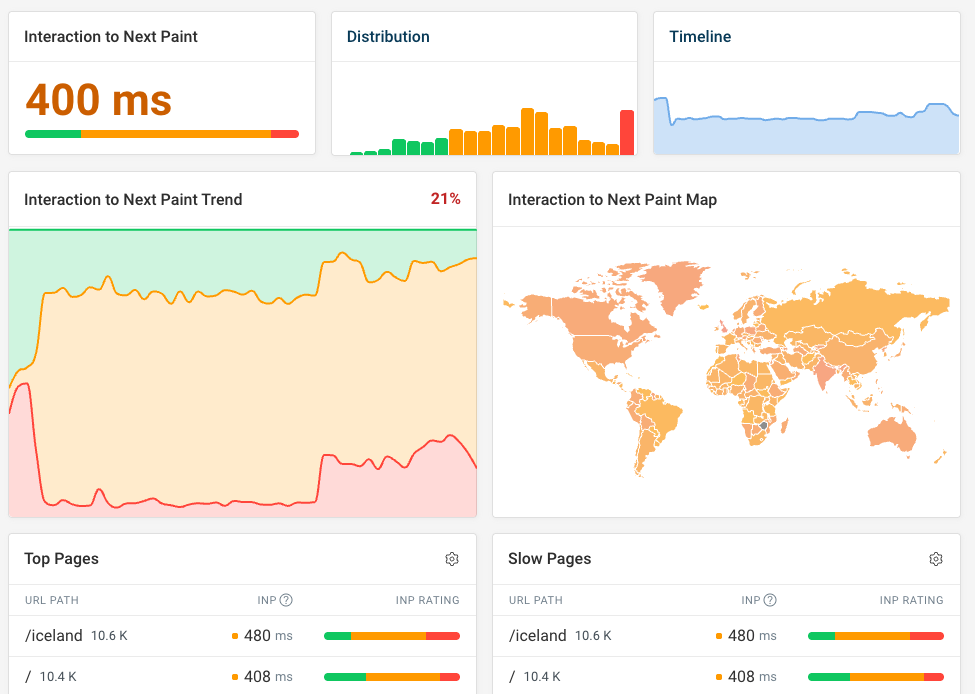
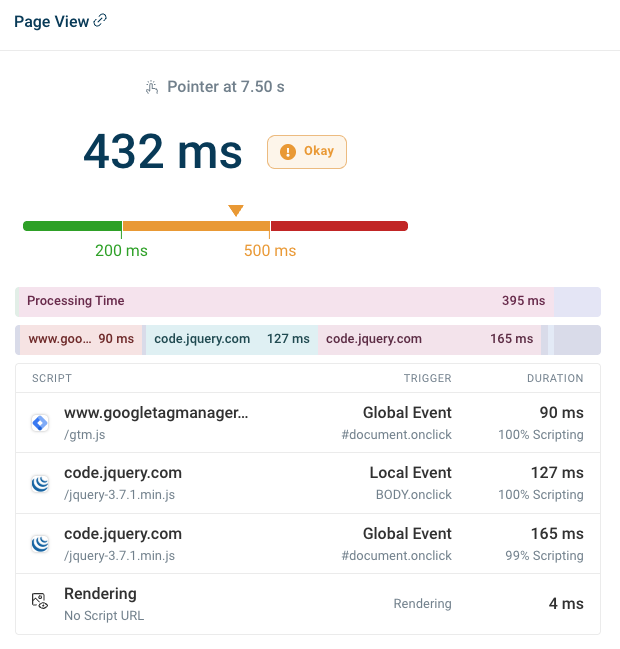
Individual page views can be inspected to see what caused poor performance for that user.
If interactions are slow, DebugBear uses the Long Animation Frames API to surface what scripts are causing delays and why they were running.
Uptime monitoring in DebugBear
DebugBear's uptime monitoring works like Pingdom's uptime checks. You add a URL, pick a check frequency between every minute and every hour, and DebugBear alerts you when the page stops responding.
Each check can validate more than just the status code. You can define an outage as any of these:
- An unexpected response code, with an option to follow redirects first
- A response slower than a threshold you set, for example 1000 milliseconds
- Missing text in the response body, such as a "Buy Now" button
- A missing or incorrect response header
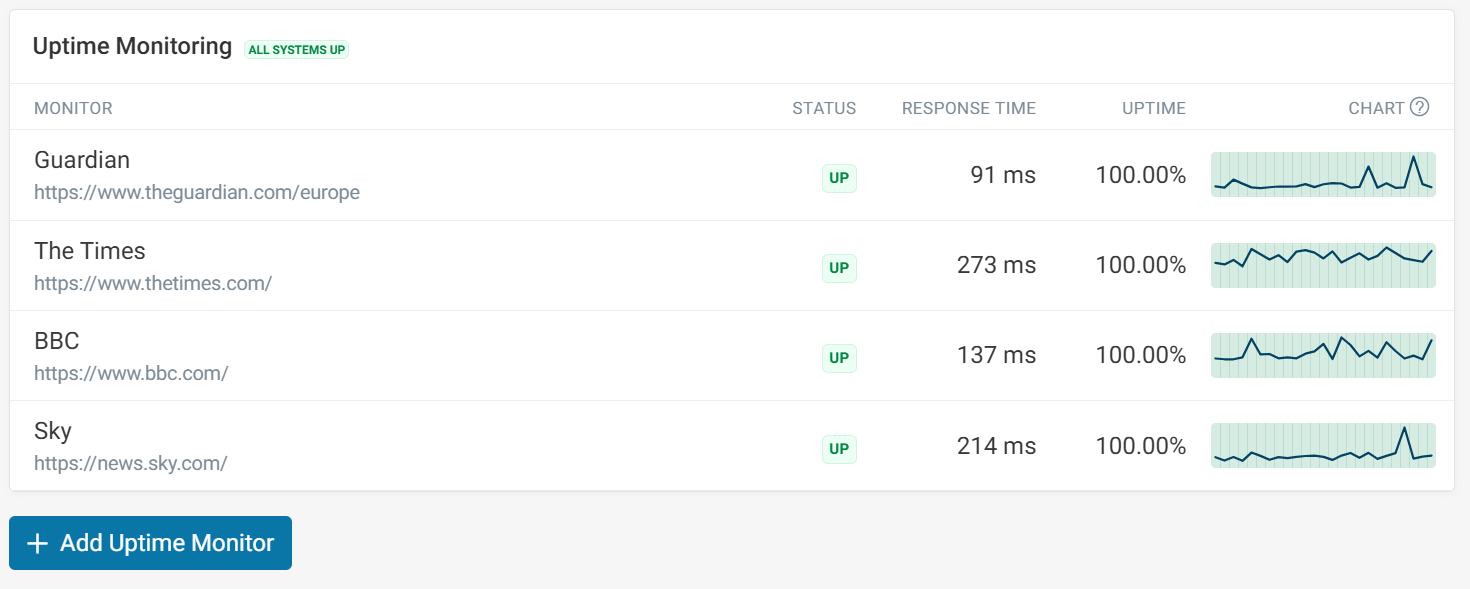
To avoid false alarms, DebugBear re-runs a failed check from a second region before recording an outage. You can also require three or five consecutive failures before it alerts you.
Uptime alerts go out by email, Slack, or Microsoft Teams, and a recovery alert follows once the site is back up. The alert names the monitor and the failure reason, for example a 403 status code or a timed-out request.
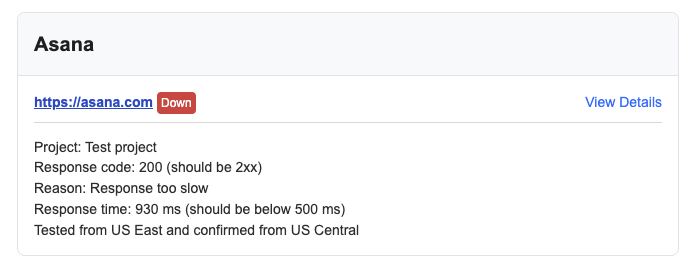
You can also keep track of server response time and review recent incidents. Because uptime checks and page speed tests live in the same project, you can set up one set of performance alerts that tell you both when the site goes down and when it gets slower.
Pros:
- Comprehensive Core Web Vitals data
- In-depth reporting
- Supports running experiments for testing optimizations without deploying code
- Uptime checks every minute with validation of status, response time, content, and headers
- Outage confirmation from a second region and alerts by email, Slack, or Teams
Cons:
- No server-side or infrastructure monitoring
- No public status pages
StatusGator: Uptime monitoring across your whole infrastructure
StatusGator can continuously check the availability of your website, but it goes beyond that: it acts as a status page aggregator for all services used by your company.
That way you can create custom status pages that let everyone in your organization see what outages are impacting operations.
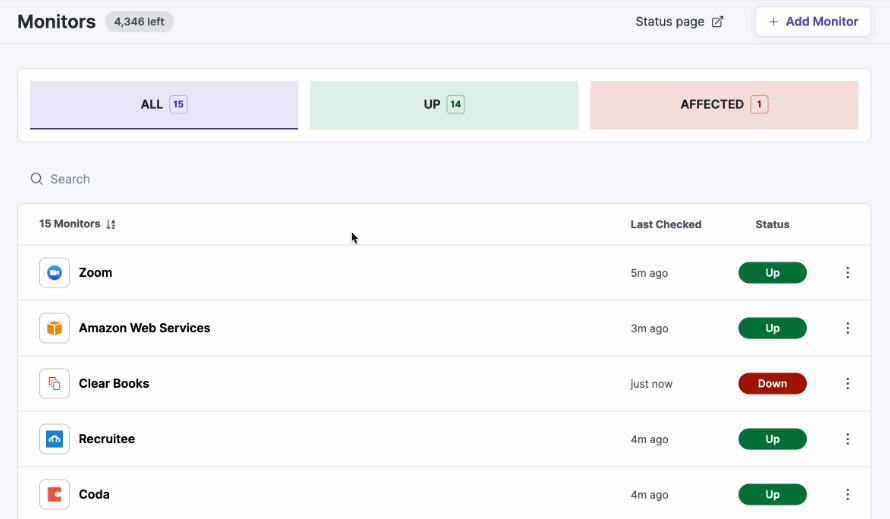
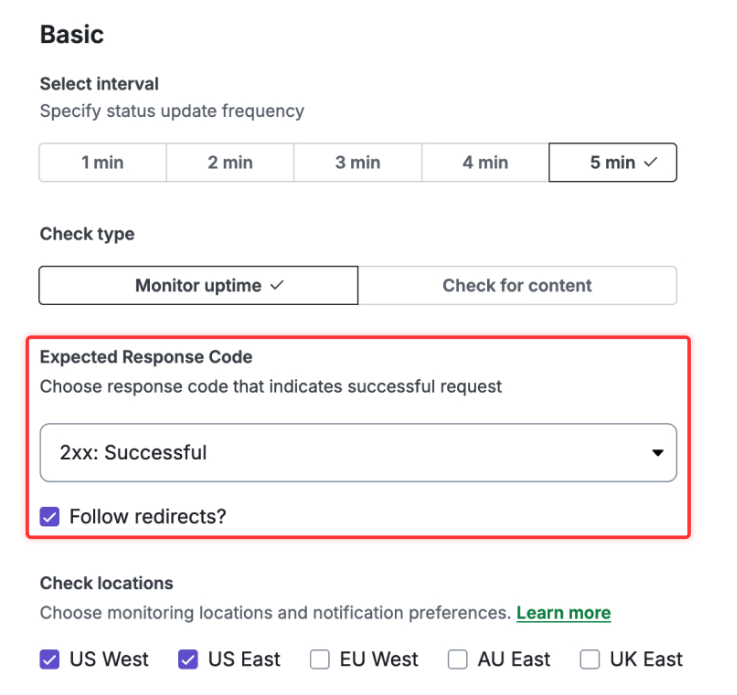
You can also set up your own HTTP uptime checks. Every one to five minutes, StatusGator checks whether the server responds correctly, and it can inspect the response body for specific content to confirm the page loaded.
Pros:
- Status page aggregation
- High-frequency uptime checks
- Customizable alerts
Cons:
- No web performance insight or real user monitoring
Datadog: A comprehensive monitoring solution
If you're looking for a more comprehensive Pingdom alternative, then Datadog can help you monitor all aspects of your IT infrastructure.
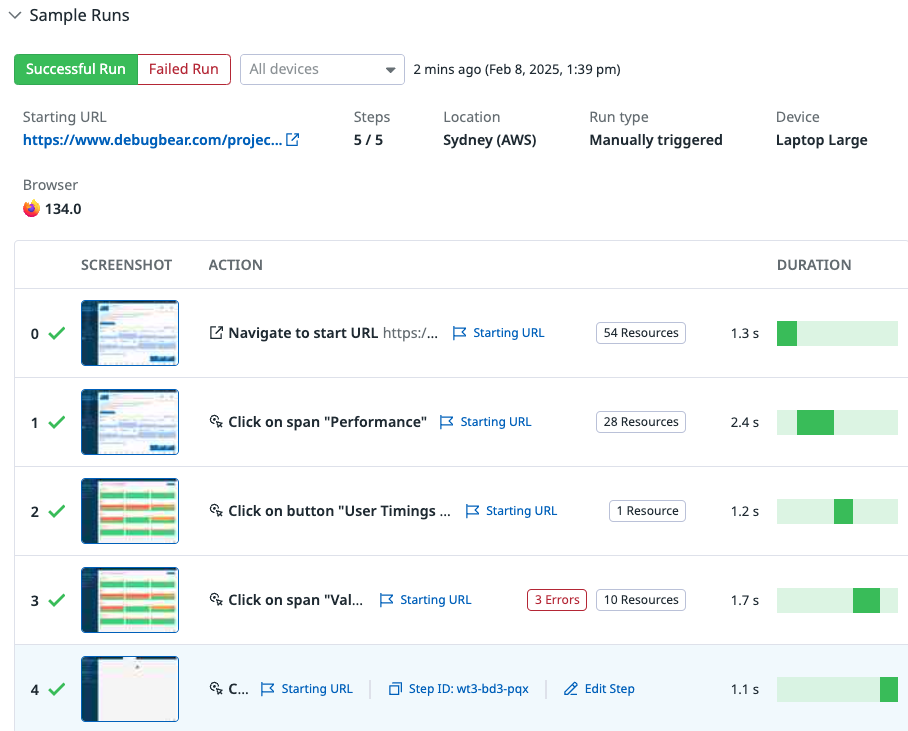
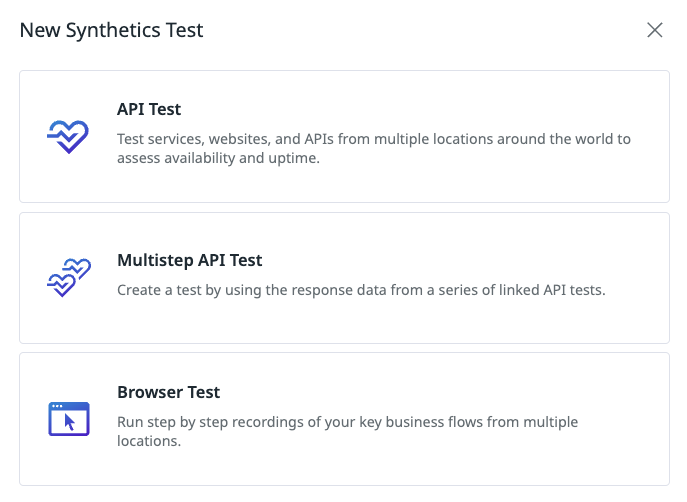
For synthetic tests you can run API tests as well as browser-based tests. Browser testing includes support for complex transaction monitoring, for example if you want to measure the performance of an ecommerce checkout flow.
Pros:
- Covers all monitoring needs
- Great recorder for transaction monitoring
- Flexible dashboards
Cons:
- Less detailed page speed reporting
- Complex pricing when using different services
- No Google CrUX data
SigNoz: Affordable infrastructure monitoring
SigNoz is a Pingdom alternative that lets you track logs, performance, or errors based on the OpenTelemetry protocol. The product provides a lot of flexibility, however it's not built specifically for a performance and uptime monitoring use case and requires some technical setup.
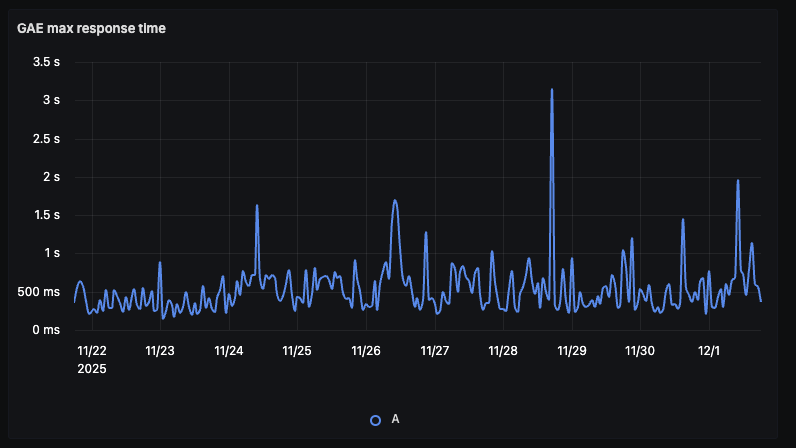
You can build custom dashboards and set up alerts to detect outages or performance issues.
Pros:
- Flexible dashboards
- Open-source platform
- Affordable pricing
Cons:
- Requires manual setup
- No built-in front-end performance features
Google Cloud uptime checks
If you just need simple uptime checking and paging, you can use the uptime checks feature in the Google Cloud observability product.
Set up a synthetic monitor to track latency and uptime with checks every minute. Checks can run from several regions and validate the status code or the response content.
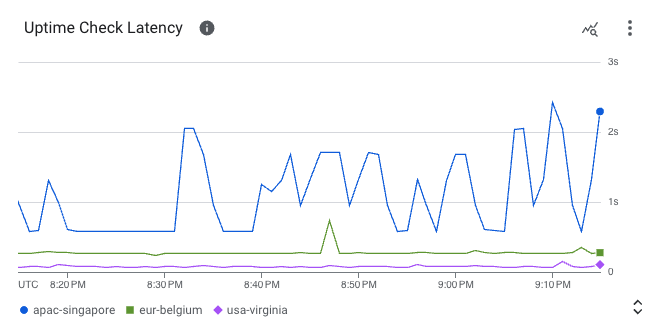
Results land in Cloud Monitoring dashboards next to your other infrastructure metrics. To get notified about outages you create an alerting policy on the uptime check and route it to email, Slack, PagerDuty, or another notification channel.
Pros:
- Free for the first one million checks per month
- No need for a new service if you're already using Google Cloud
Cons:
- Focused tool on uptime instead of overall page speed
Uptime.com: Availability checks and status pages
Uptime.com is a dedicated tool just for tracking website uptime. You can also configure both public and internal status pages.
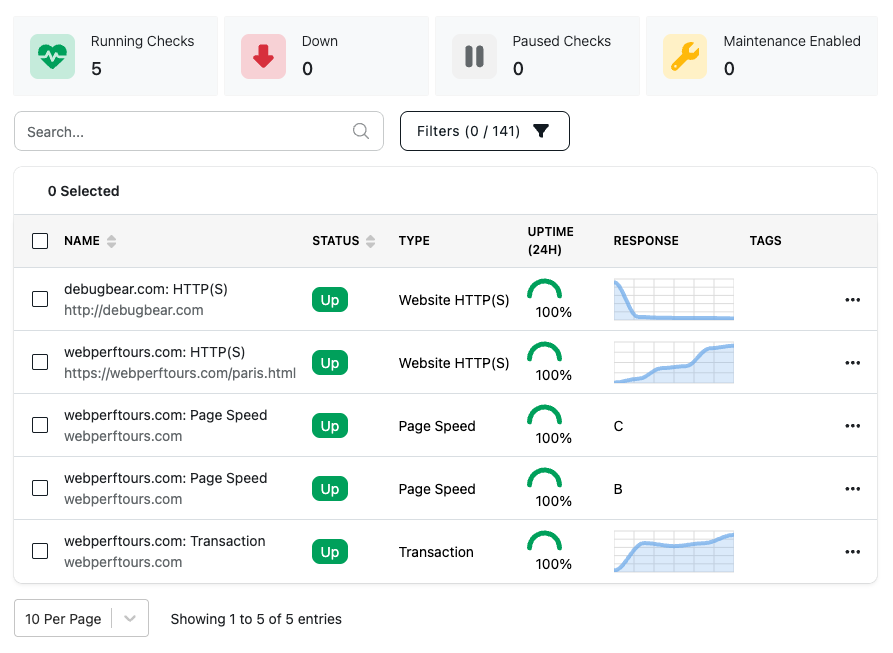
The status checks offer a large number of configuration options, for example:
- Testing website status, API status, and more
- A large number of test locations
- Contacts and escalation policies
- Retry and timeout configuration
Status pages update automatically based on the collected check data.
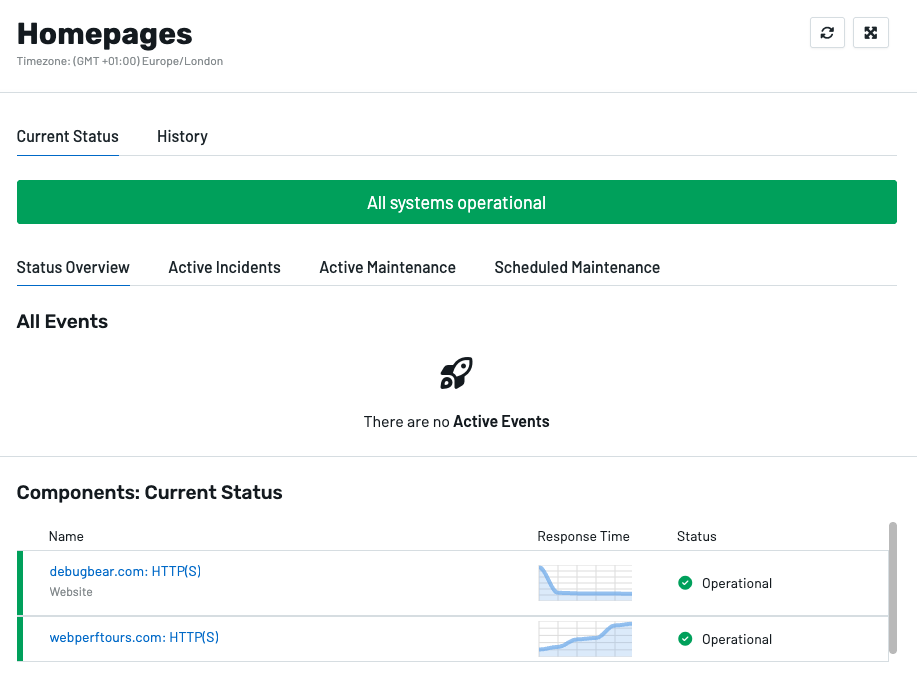
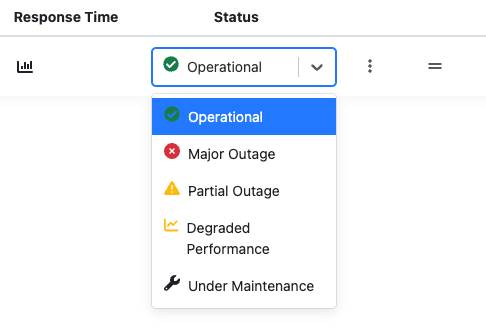
You can also manually update the status of different components of your service, as well as provide additional details for incidents on your website.
Pros:
- Advanced public and internal status pages
- Many test locations and check types
- Escalation policies for alerts
Cons:
- No detailed page speed monitoring
Uptrends: Digital experience monitoring
Uptrends is another comprehensive tool that supports different types of website monitoring.
You can set up flows to monitor transactions, monitor uptime, or monitor real user metrics.
Transaction monitoring uses a recorder to script multi-step journeys like a login or checkout, and each step reports its own timing so you can see where a flow slows down. Uptime checks cover HTTP, DNS, SSL certificates, and more, and run from a large network of checkpoints around the world.
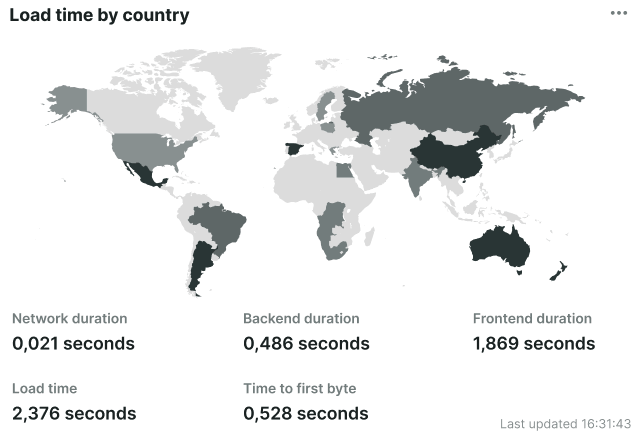
The real user monitoring dashboards report page load times by page, browser, and location. Pricing works on a credits system, where each type of monitor uses a different number of credits, so costs take some planning to predict.
Pros:
- Comprehensive monitoring
- Custom dashboards
Cons:
- More complex credits-based pricing
Looking for a specific type of monitoring tool?
If you're looking for a tool that can handle a specific aspect of monitoring your website, check out these articles on our website:
- Uptime monitoring tools
- Real user monitoring tools
- Synthetic monitoring tools
- Website performance monitoring tools
How to pick a Pingdom alternative
Which Pingdom alternative is best for you depends on whether you need more in-depth reporting or are just looking for a general-purpose tool that covers all your needs.
Most Pingdom competitors offer a free trial, so you can try out different solutions and see what works best for you.
Check if the tool charges a fixed monthly price or if pricing is variable. Unexpected overage fees can make it difficult to predict costs and control your expenses.
If Core Web Vitals are important to you, check if the tool also monitors the CrUX metrics Google collects from real Chrome users.
For uptime monitoring, compare the shortest check interval, what the check can validate beyond the status code, whether failures are confirmed from a second location, and which alert channels are supported.
DebugBear is a tool built for web performance monitoring, providing advanced support for both synthetic monitoring and real user monitoring, alongside uptime monitoring with one-minute checks.
Why is website monitoring important for your business?
What is the use case for tools like Pingdom in the first place? Monitoring your websites has a few key benefits:
- Detecting poor performance and user experience
- Checking if page speed is impacting SEO
- Making sure the website has high availability
- Giving your team visibility into the visitor experience
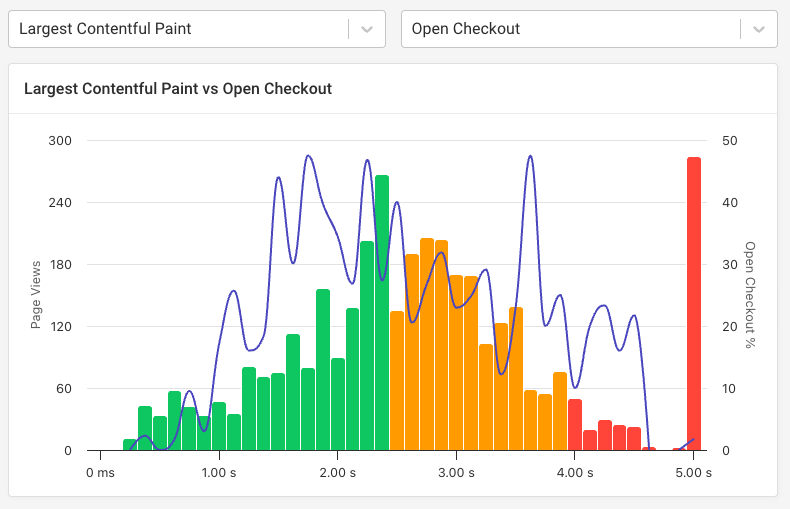
Conversion tracking can help you measure the business impact of optimizing page speed and user experience.
Monitor Page Speed & Core Web Vitals
DebugBear monitoring includes:
- In-depth Page Speed Reports
- Automated Recommendations
- Real User Analytics Data