Pingdom Alternative

Looking for Pingdom alternatives?

Monitor uptime, run scheduled page speed tests, and track real user Core Web Vitals data
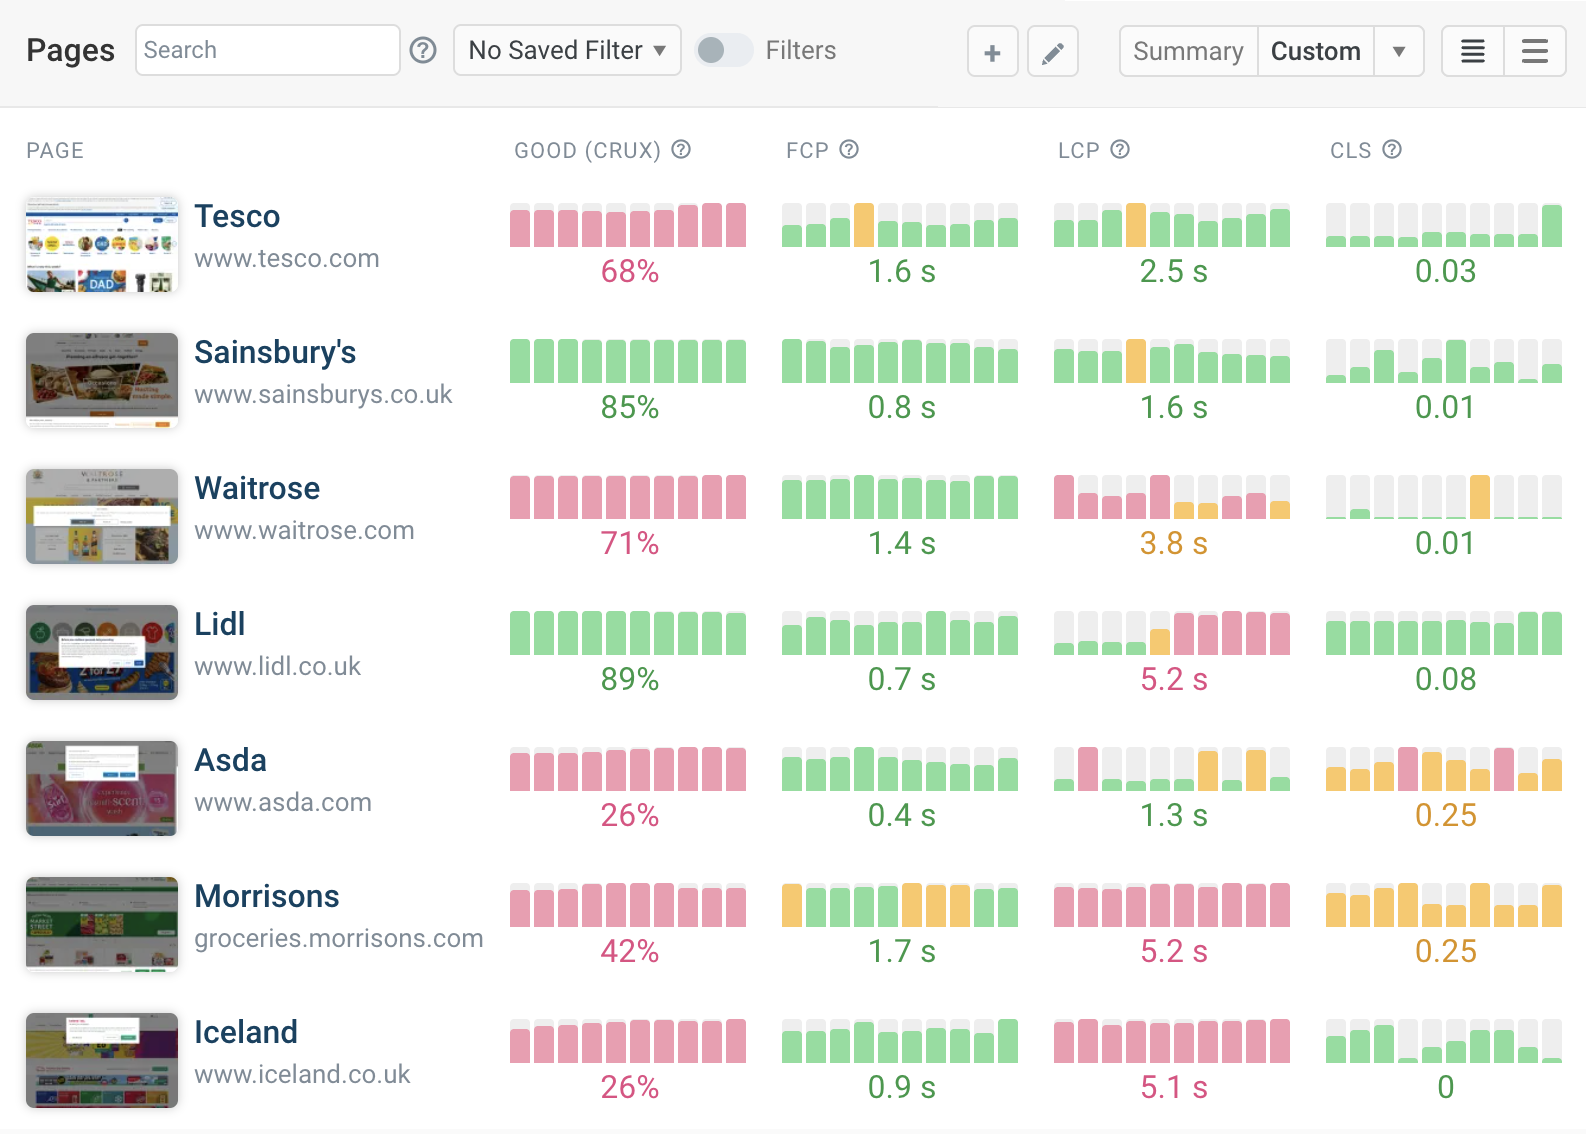
Pingdom alternative page speed dashboard
“We've updated around 15,000 pages and saw some nice gains from it. "Good URLs" and their impressions have increased 3x since implementation.”
Web performance monitoring user profile picture
Rafayel Begoyan
Senior SEO Specialist
CoinStats logo
“DebugBear has been an eye opener for us and has really shown what's causing the Core Web Vitals issues on our website.

Web peformance monitoring user profile picture
Mandip Ahdan
Head of Engineering
The Independent logo
We help startups, agencies, and enterprises keep their website fast
DebugBear Customers DebugBear Customers

Uptime Monitoring

Get alerted when your site goes down

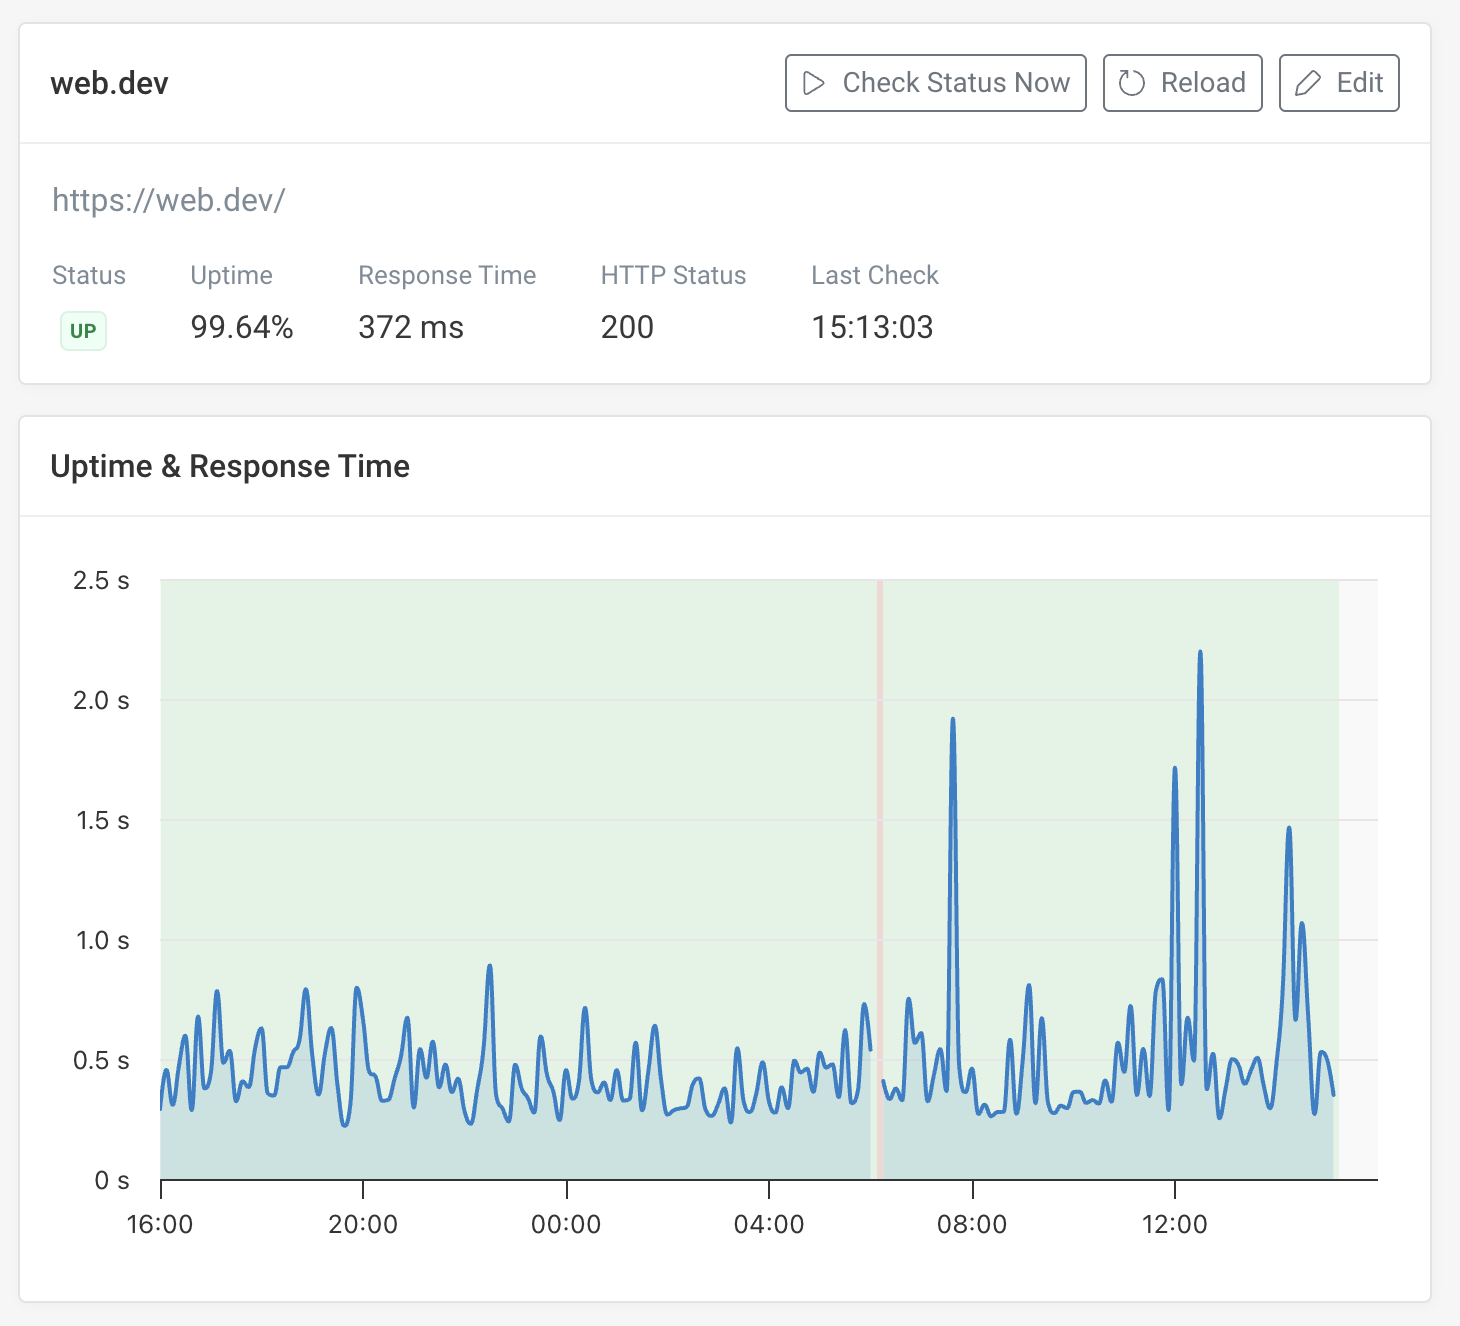
Like Pingdom, DebugBear checks that your website is up as often as every minute. You get notified by email, Slack, or Microsoft Teams when it isn't, and again when it recovers.

Validate more than the status code

Fail a check if the server responds too slowly, if expected text is missing from the page, or if a response header has the wrong value.

Fewer false alarms

Outages are confirmed from a second region before you get alerted, and you can wait for several consecutive failures to filter out one-off blips.

Uptime and page speed in one place

Pingdom offers uptime and page speed checks, but only basic page speed data. DebugBear combines uptime checks, in-depth synthetic tests, and real user monitoring in one subscription.

Website uptime monitoring chart

Site Speed Dashboards

See how site speed changes over time

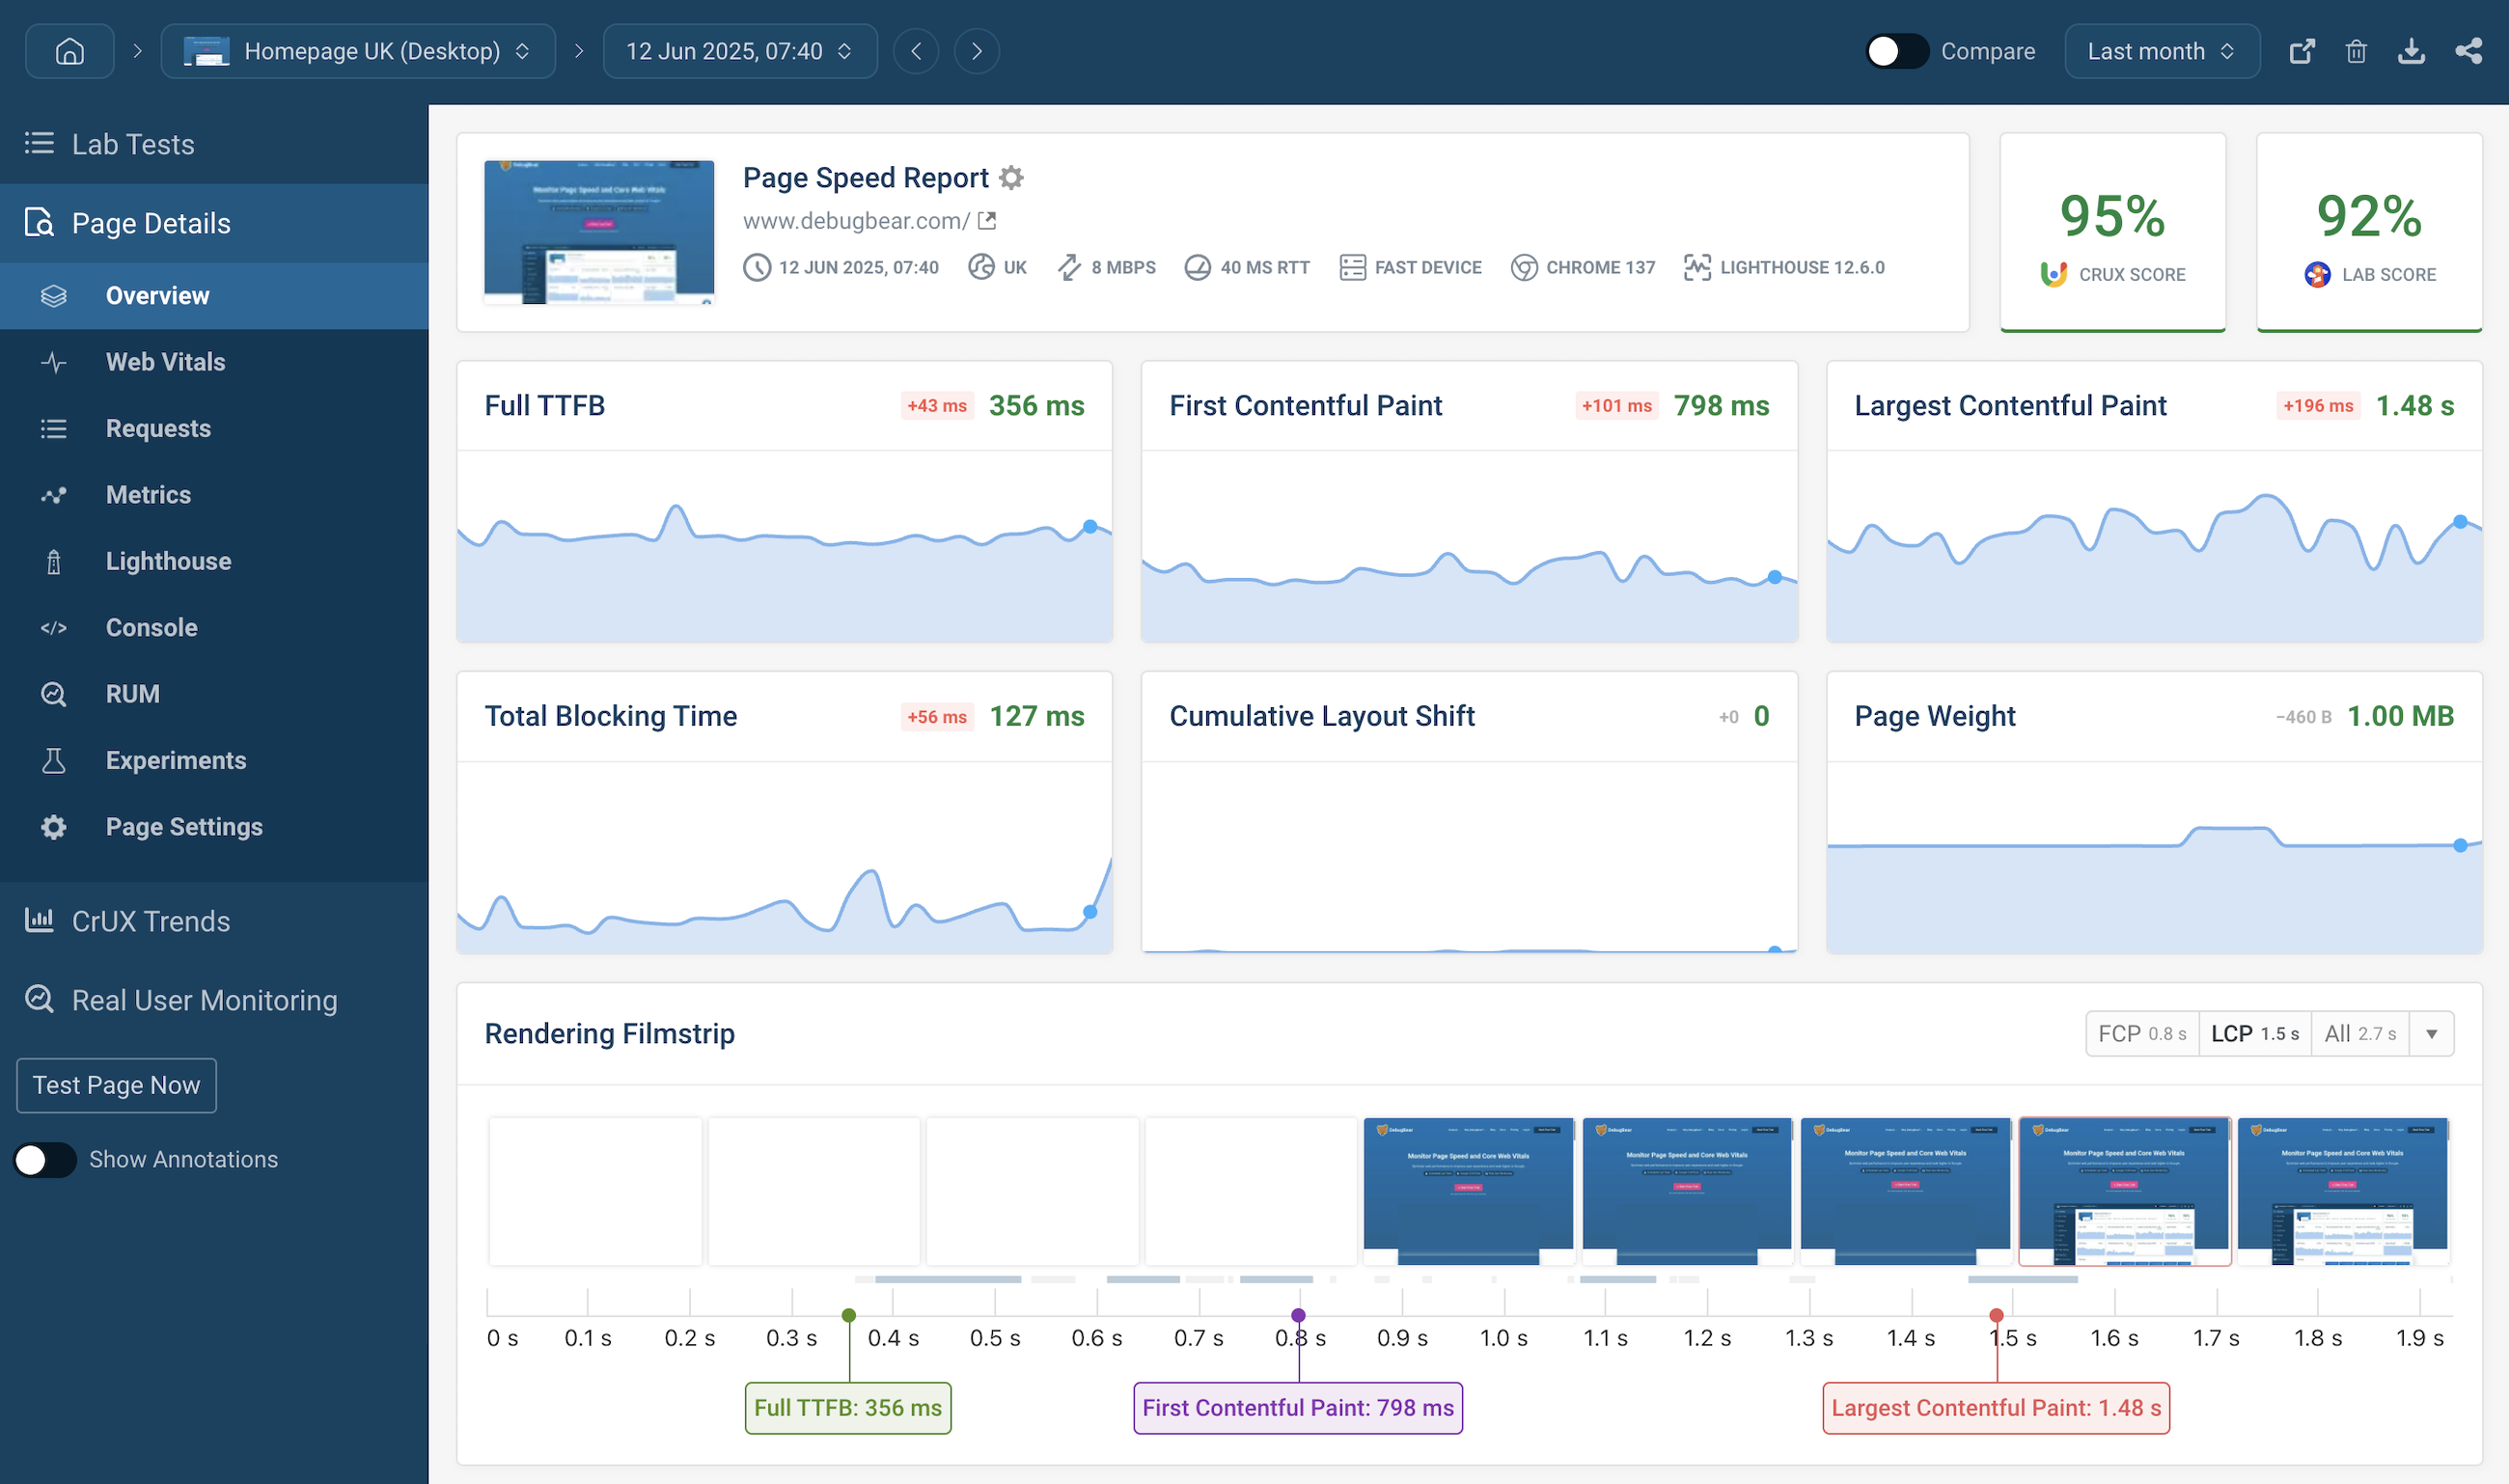
DebugBear runs daily performance tests and keeps track of over 50 performance metrics, for example the Largest Contentful Paint or Load Time.

Lighthouse-based

DebugBear is built on top of Google's Lighthouse tool. Just like Pingdom we provide you with a waterfall and possible fixes to your site. However, unlike Pingdom, we also show SEO and Accessibility metrics.

Core Web Vitals Field Data

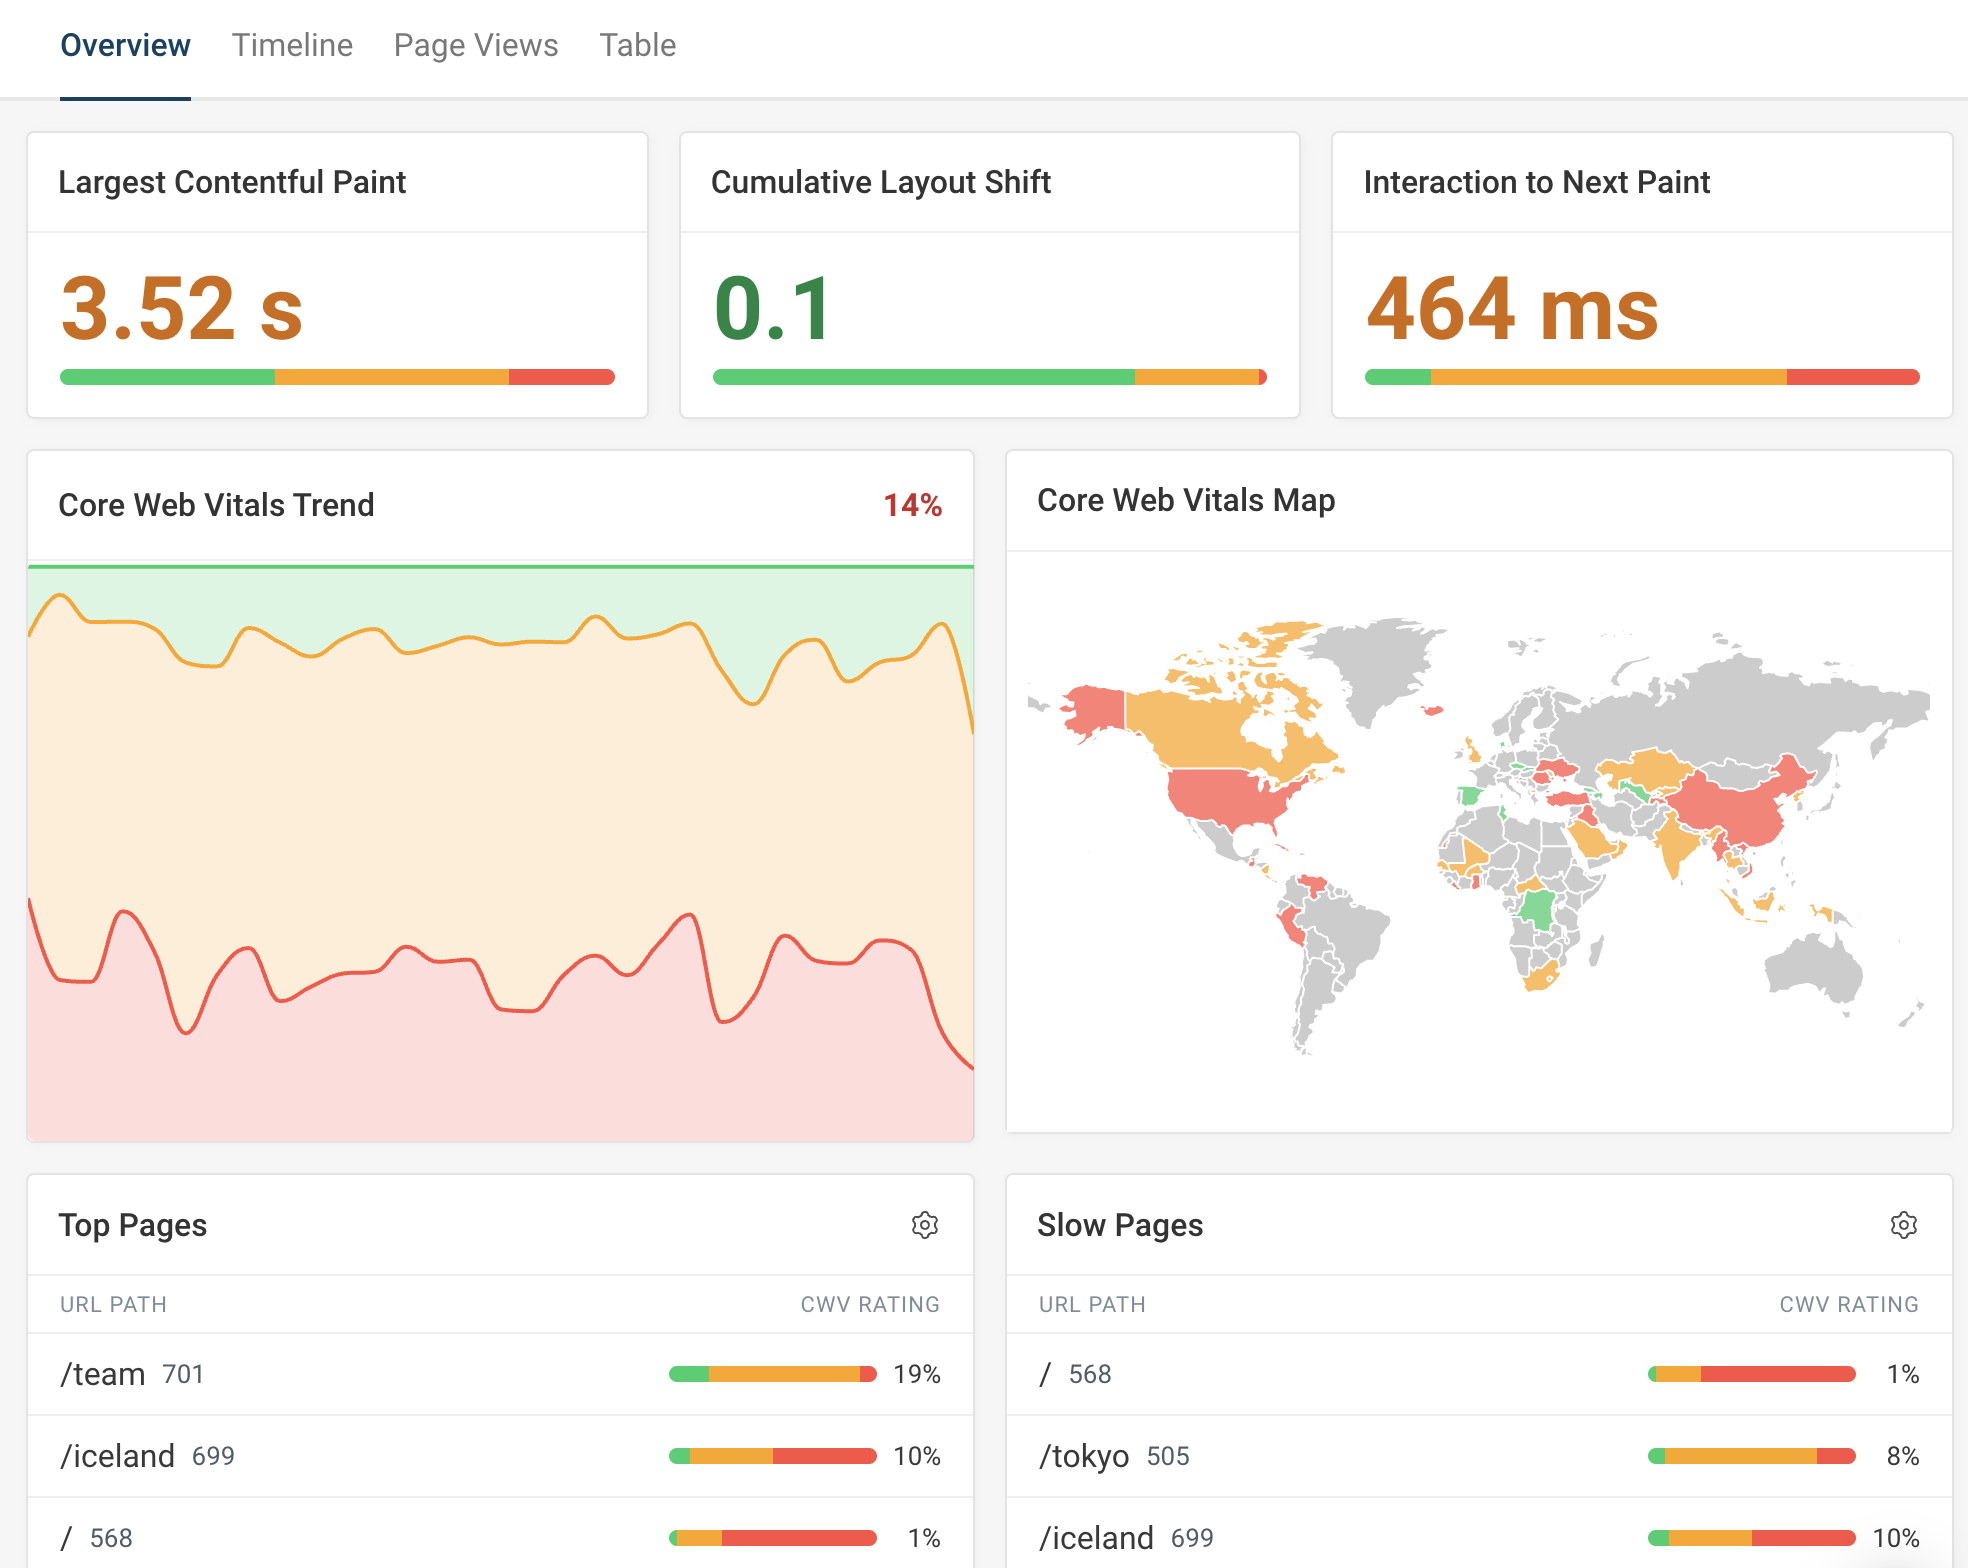
Keep track of the real user web vitals metrics that can impact your rankings.

Front-end web performance monitoring dashboard

Dive deep into the data

In-depth test results

DebugBear collects detailed debug data that helps you understand your metrics. Compare two test results and see exactly what changed.

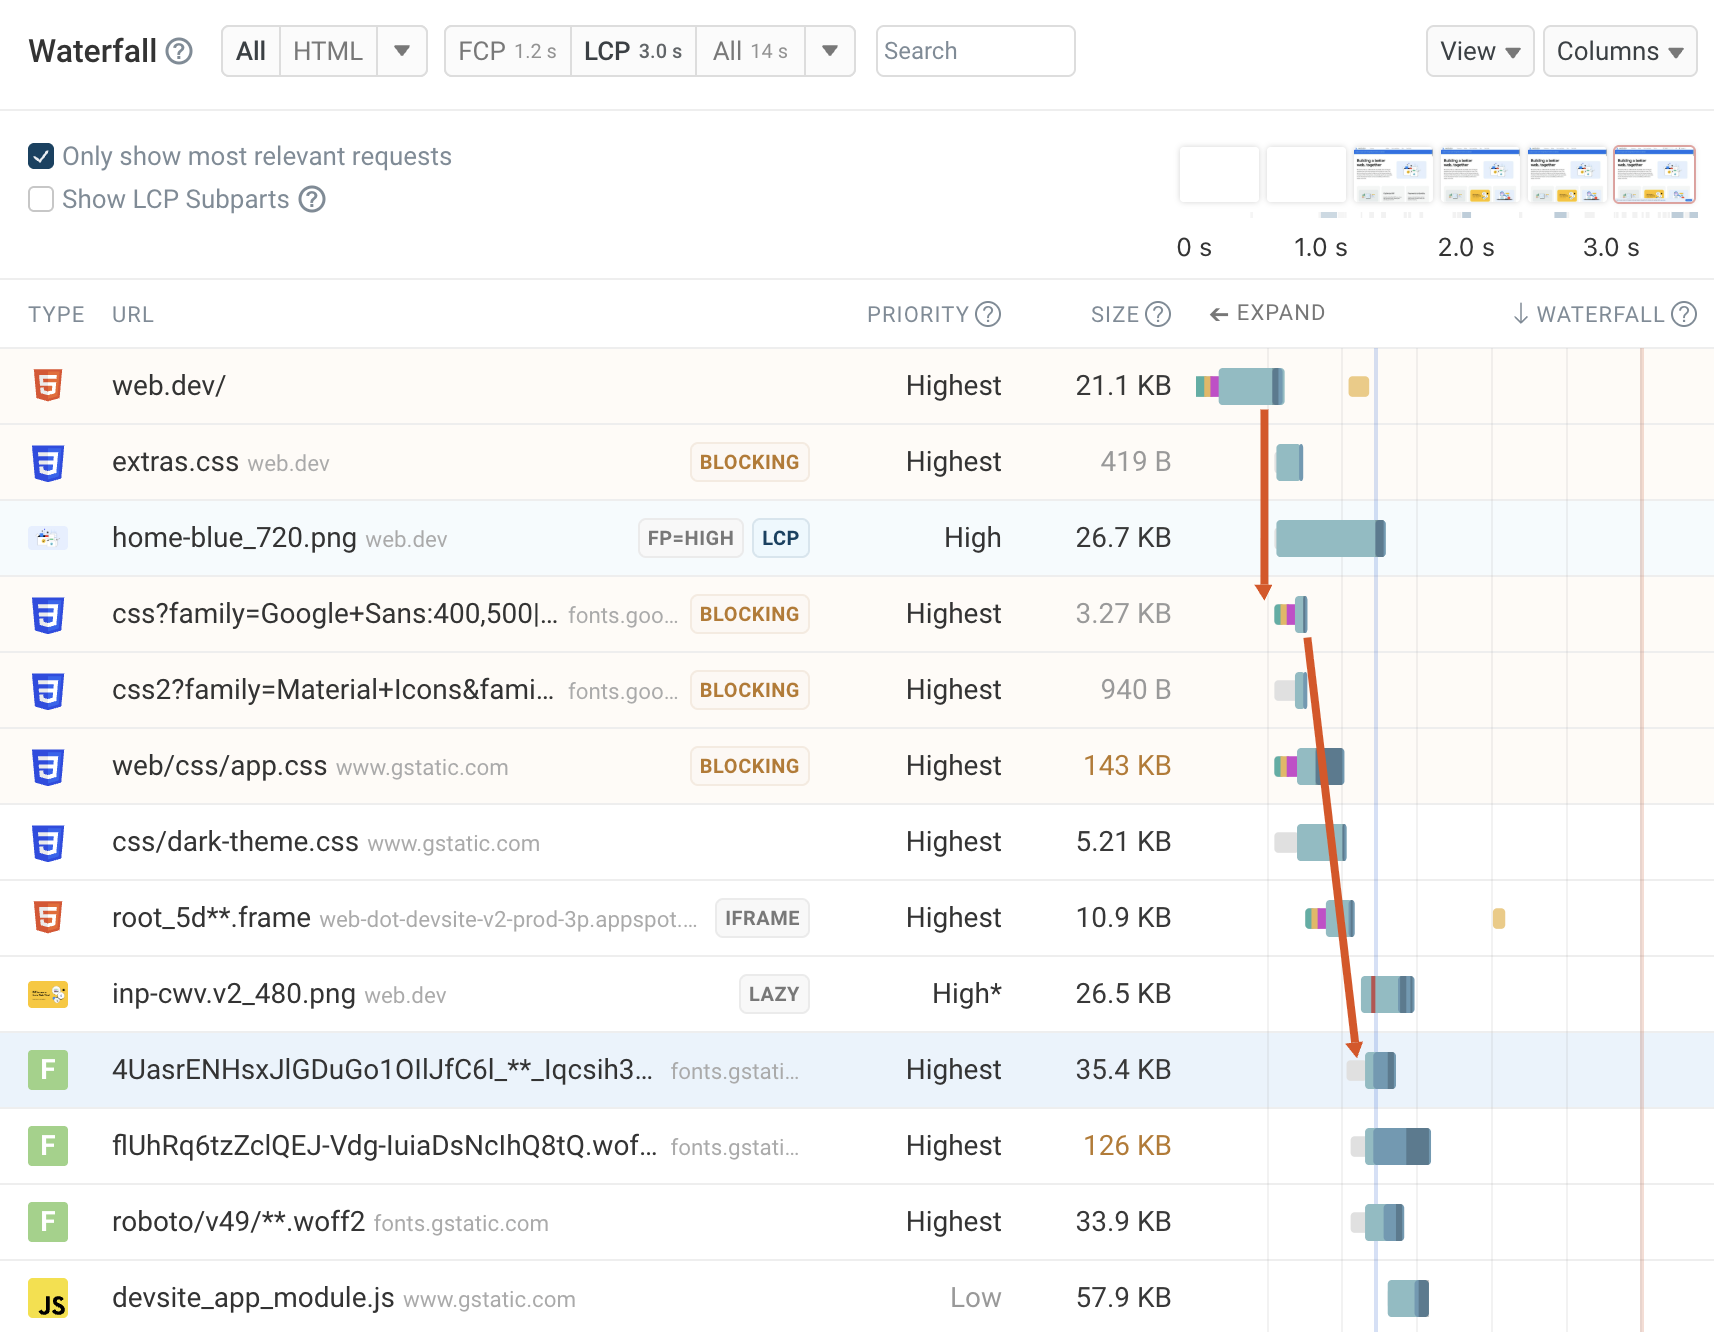
Request waterfall

DebugBear and Pingdom provide a request waterfall showing you in what order different parts of your page loaded.

However, DebugBear goes a step further by exposing details like how different requests were prioritized by the browser.

Debug Web Vitals

See what element caused the Largest Contentful Paint and get a list of all layout shifts on the page.

Request weight and bundle size

Real User Monitoring (RUM)

Measure visitor experience on your website

Keep track of real user website performance metrics and get in-depth segmentation data.

Identify and fix slow experiences

See how performance varies across the world and get detailed page speed breakdowns to optimize user experience.

Modern debug data

Break down poor website scores and identify scripts and network requests that are slowing down your site.

DebugBear RUM dashboard

Measure the business impact of user experience
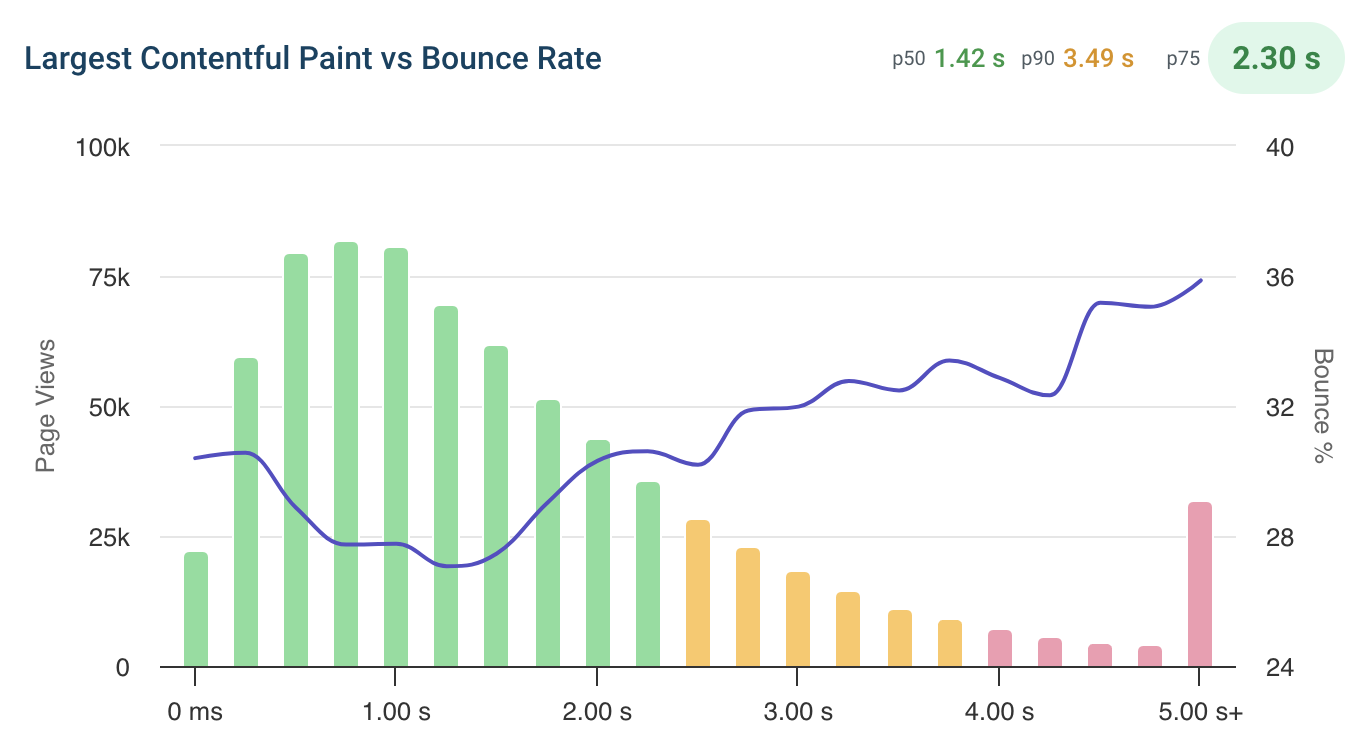
Correlate performance to bounce rate

See how different performance metrics impact your bounce rate and optimize your website for better user engagement.

Increase visitor happiness

Deliver a great website experience so you can educate visitors about your offering and make them come back again.

LCP to bounce rate correlation

Customize your tests

Test pages behind authentication

Got an app that's only accessible after logging in? Fill out a login form before tests are run or set a Basic Auth header.

30+ test locations

Run your tests where your users are, from 30+ locations around the world. Pingdom beats DebugBear here, with over 100 global test locations.

Advanced features

There are many similar tools to Pingdom. DebugBear shines at customizability. Specify exactly when to run tests, set performance budgets, track custom user timing metrics, and get uptime alerts and page speed alerts through the same notification channels.

Web performance monitoring: filmstrip and list of request

Get set up in minutes.

No credit card required.

You are using an old browser that is not supported anymore. You can continue using the site, but some things might not work as expected.