
Single-page applications often struggle with poor performance. However, it can be difficult to identify where these issues occur and how to fix them.
In this article we take a look at the challenges that single-page apps pose for performance measurements and what you can do to analyze and optimize your web app.
The SPA monitoring challenge: hard vs. soft navigations
Traditional multi-page apps completely reset the page and load a new HTML document every time a visitor clicks on a link.
In contrast, single-page apps start with one hard navigation, but clicking in the app just results in a soft navigation. The page URL changes and the page content is updated, but the browser is still displaying the same document.
That poses a few questions for monitoring SPA performance:
- Is opening an SPA a single page view, or many separate page views?
- When does a new page view happen? For every URL change or just user-initiated ones?
- Do you measure performance throughout the lifetime of the page or just for the initial page content?
- Do you attribute metrics to the original page URL, or one of the later URLs?
How Google's Chrome User Experience Report (CrUX) handles soft navigations
For the data Google collects as part of the Chrome User Experience Report, all measurements are attributed to the original page URL.
So if a user visits /home, navigates to /product in an SPA, and then has a slow interaction on that page, the Interaction to Next Paint score for /home will increase!
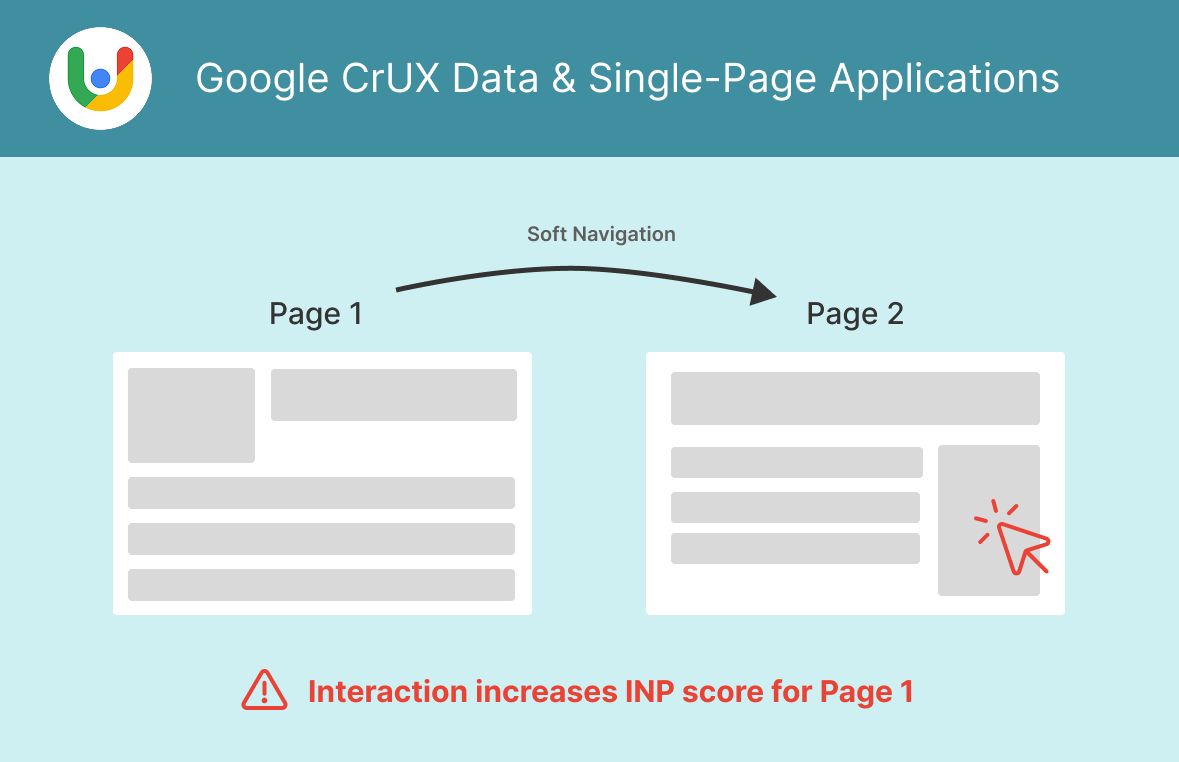
Like INP, Cumulative Layout Shift can increase throughout the lifetime of the application.
The Largest Contentful Paint score works differently: it's final once a user interacts with the page. That means it always measures the initial load time of the page. If other parts of the app load slowly then that does not impact LCP scores.
Chrome 151 adds Core Web Vitals reporting for soft navigations
For a long time there was no standardized way to measure page views inside a single-page application. That changed with Chrome 151, released in August 2026, which added support for measuring Core Web Vitals for soft navigations.
This builds on the work to standardize what counts as a new page view and to measure separate paint timings for each page, which Google tested through an origin trial starting in 2024.
Two things to keep in mind:
- Support is Chromium-only. Soft navigation metrics are not reported in Safari or Firefox, so your data will only cover part of your audience.
- Google's CrUX data continues to attribute metrics to the original page URL, so soft navigation metrics won't match what you see in CrUX or in Google Search Console.
Measuring SPA performance with real user monitoring
DebugBear's real user monitoring product measures Core Web Vitals and other web performance metrics across your website. You can use it to identify where users experience poor performance and then deep dive into the technical data to find out how to fix problems.
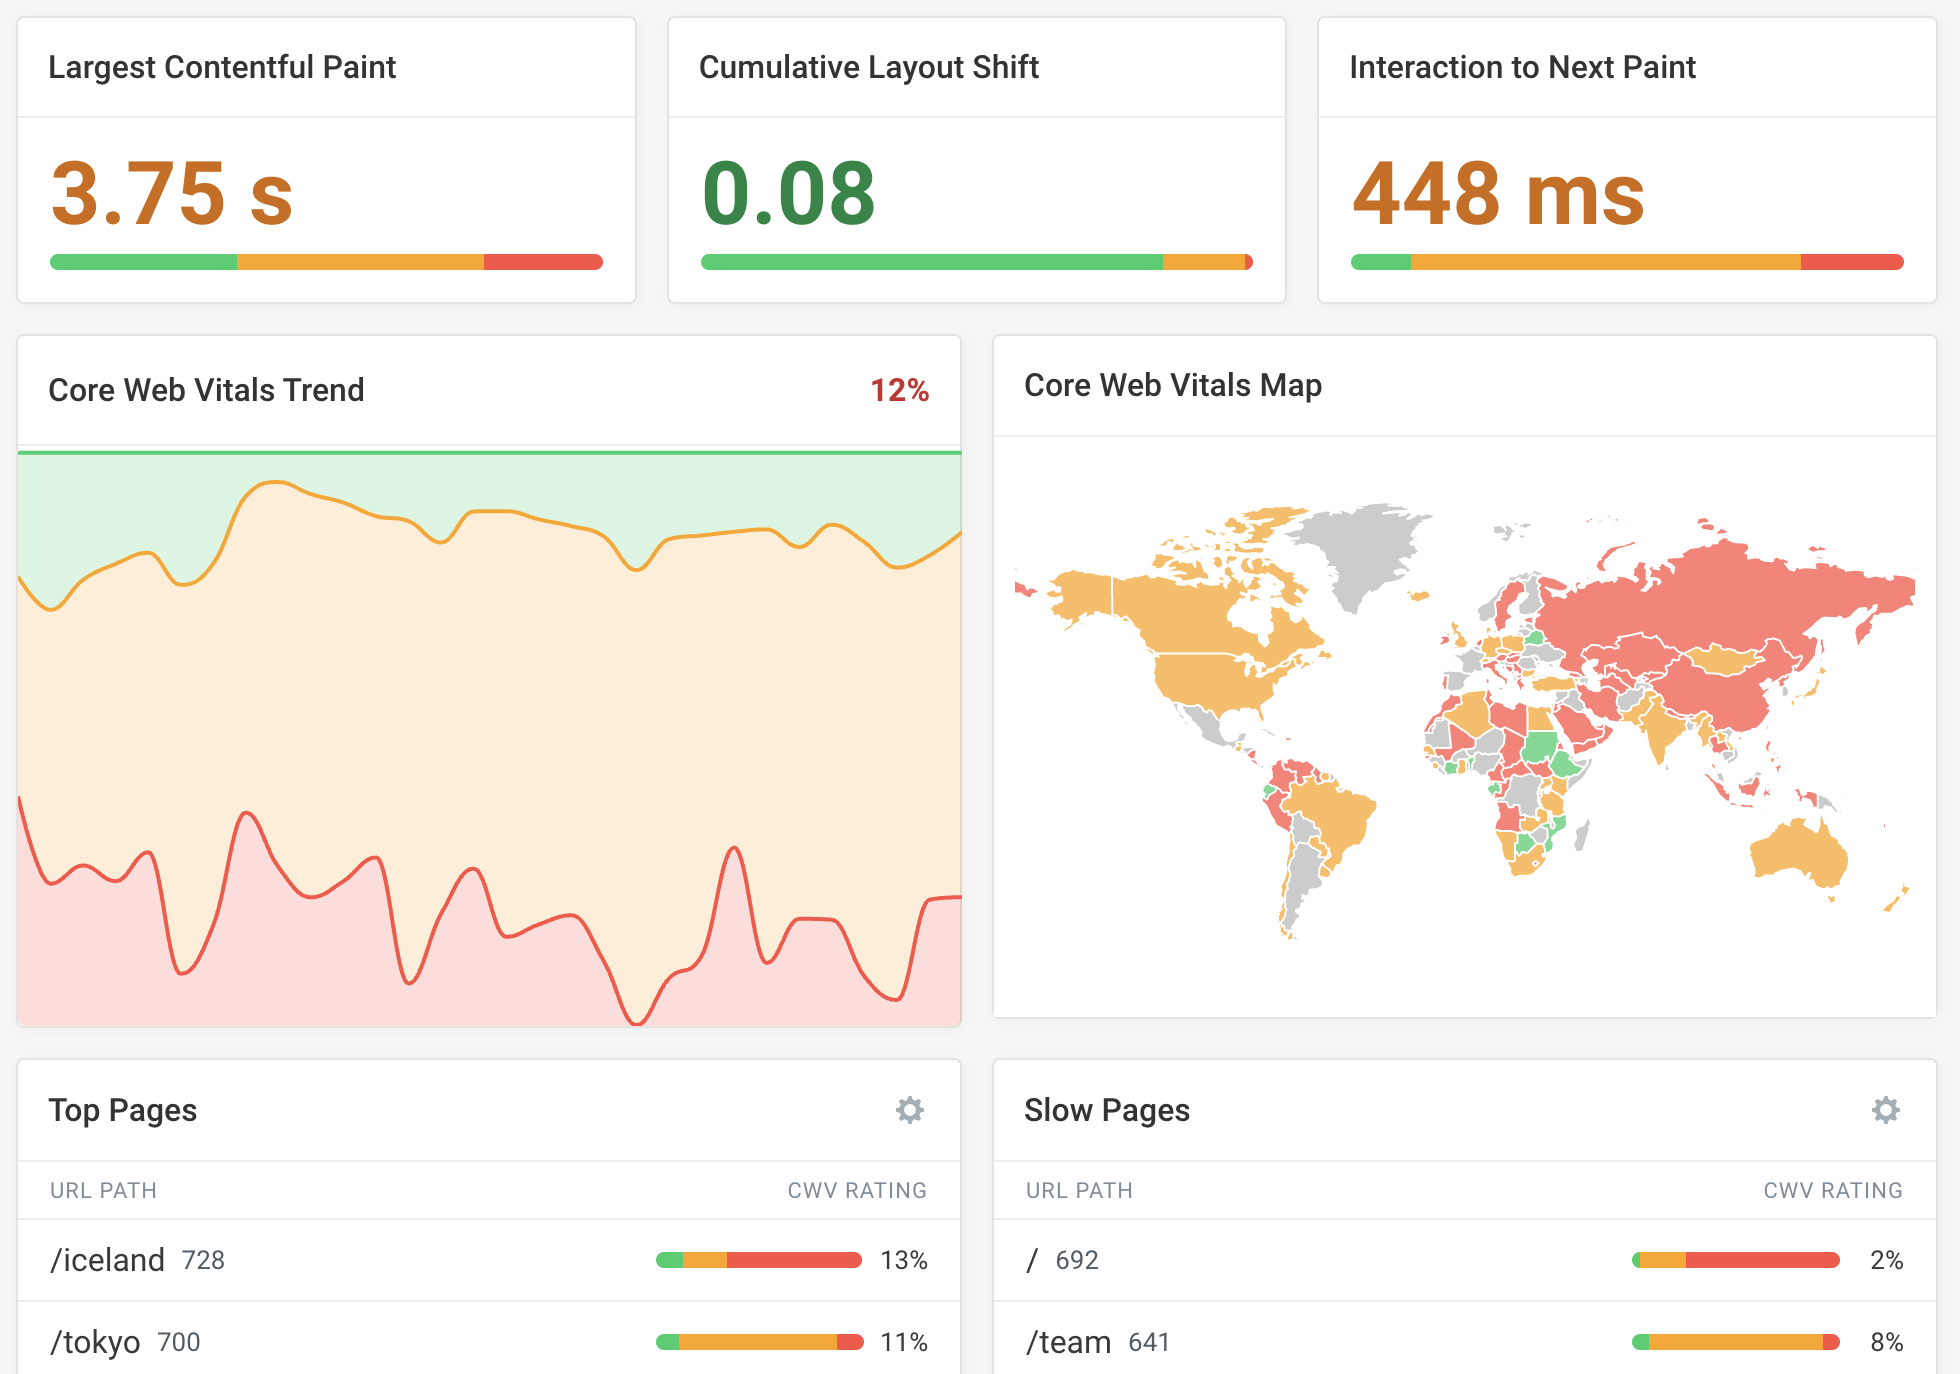
The way the metrics are recorded is aligned with Google CrUX data. So interactions and layout shifts on later pages are attributed to the original URL.
However, that's not great for debugging! That's why DebugBear also provides two additional data properties for each page view:
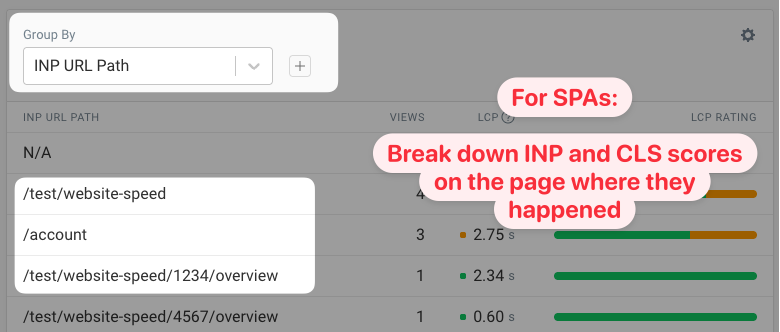
- INP URL Path: The path where the slowest interaction happened
- CLS URL Path: The path where the largest layout shift cluster was recorded
This data lets you break down which pages users experience poor CLS and INP on.
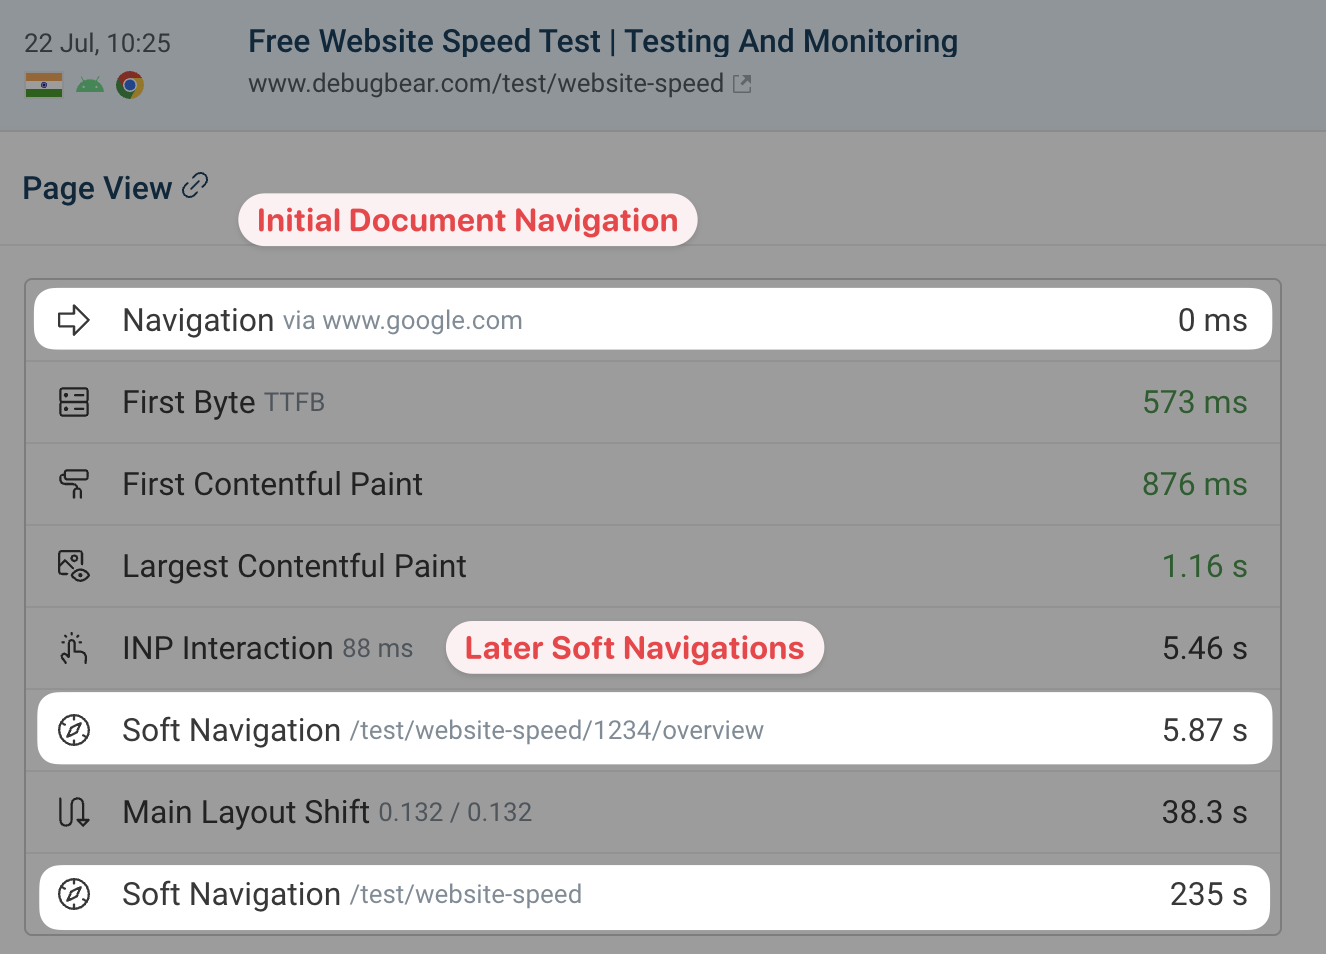
You can also inspect each specific page view to see when soft navigations occurred on the page.
Here we first see a soft navigation to a page speed test result, and then another one as the visitor uses the browser "back" button.
Reporting each soft navigation as its own page view
Following the Chrome 151 release, DebugBear can also track every soft navigation as a separate page view. You enable this with the Track SPA Soft Navigations Individually setting described in our SPA monitoring guide.
In this mode each paint, interaction, and layout shift is attributed to the page it actually happened on, rather than to the URL the visitor first opened. A session with an initial page load and three in-app navigations is reported as four page views:
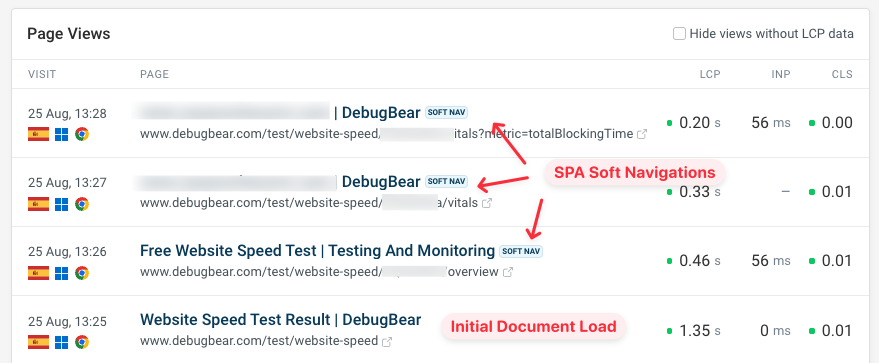
Enabling SPA mode changes your metrics in a few ways. You'll record more page views, and Time to First Byte and LCP scores usually improve, because soft navigations don't reload the whole page or contact the server. CLS and INP tend to look better too, since both are roughly worst-case metrics that are now spread across more page views.
None of that means your app got faster on the day you switched the setting, so make a note of when you changed it. If you want to look at just the initial page load, for example to compare against CrUX, you can filter your data by View Type to exclude soft navigations.
Common challenges with single-page app optimization
SPAs are prone to a specific set of web performance problems:
- Slow JavaScript-heavy user interactions, measured by Interaction to Next Paint
- Slower initial page load, measured by Largest Contentful Paint
- Layout shifts as visitors navigate through the app
- Page errors impacting user experience
Let's take a look at how performance monitoring data can help identify and fix these issues.
Check out our framework-specific guides on Next.js Performance and Vue Performance.
Debugging INP with the Long Animation Frames API
There are many causes of slow interactions in single-page apps:
- Complex logic to handle the event
- Global analytics listeners delaying updates
- JavaScript hydration preventing events from being handled
- Background tasks that need to finish before the page can update
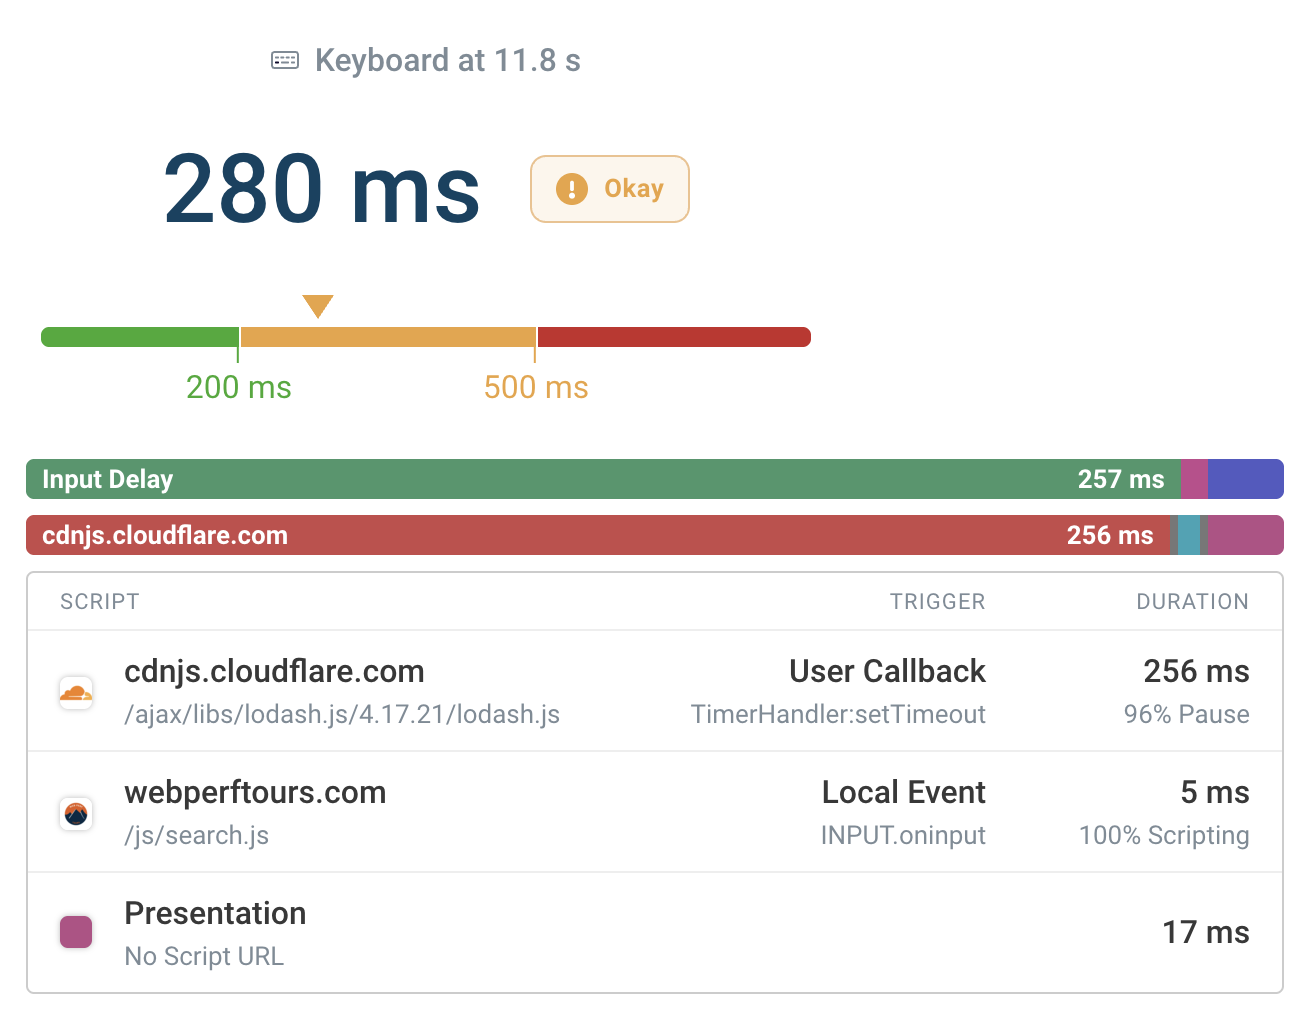
The Long Animation Frames API provides additional reporting on what scripts delay rendering updates and cause high Interaction to Next Paint scores.
Here's an example interaction. We can see that:
- Input Delay prevents the interaction from being handled
- The background task runs due to being scheduled by Lodash using
setTimeout - The actual event handler on the
inputelement only takes 5 milliseconds to run
Check the initial page load with synthetic tests
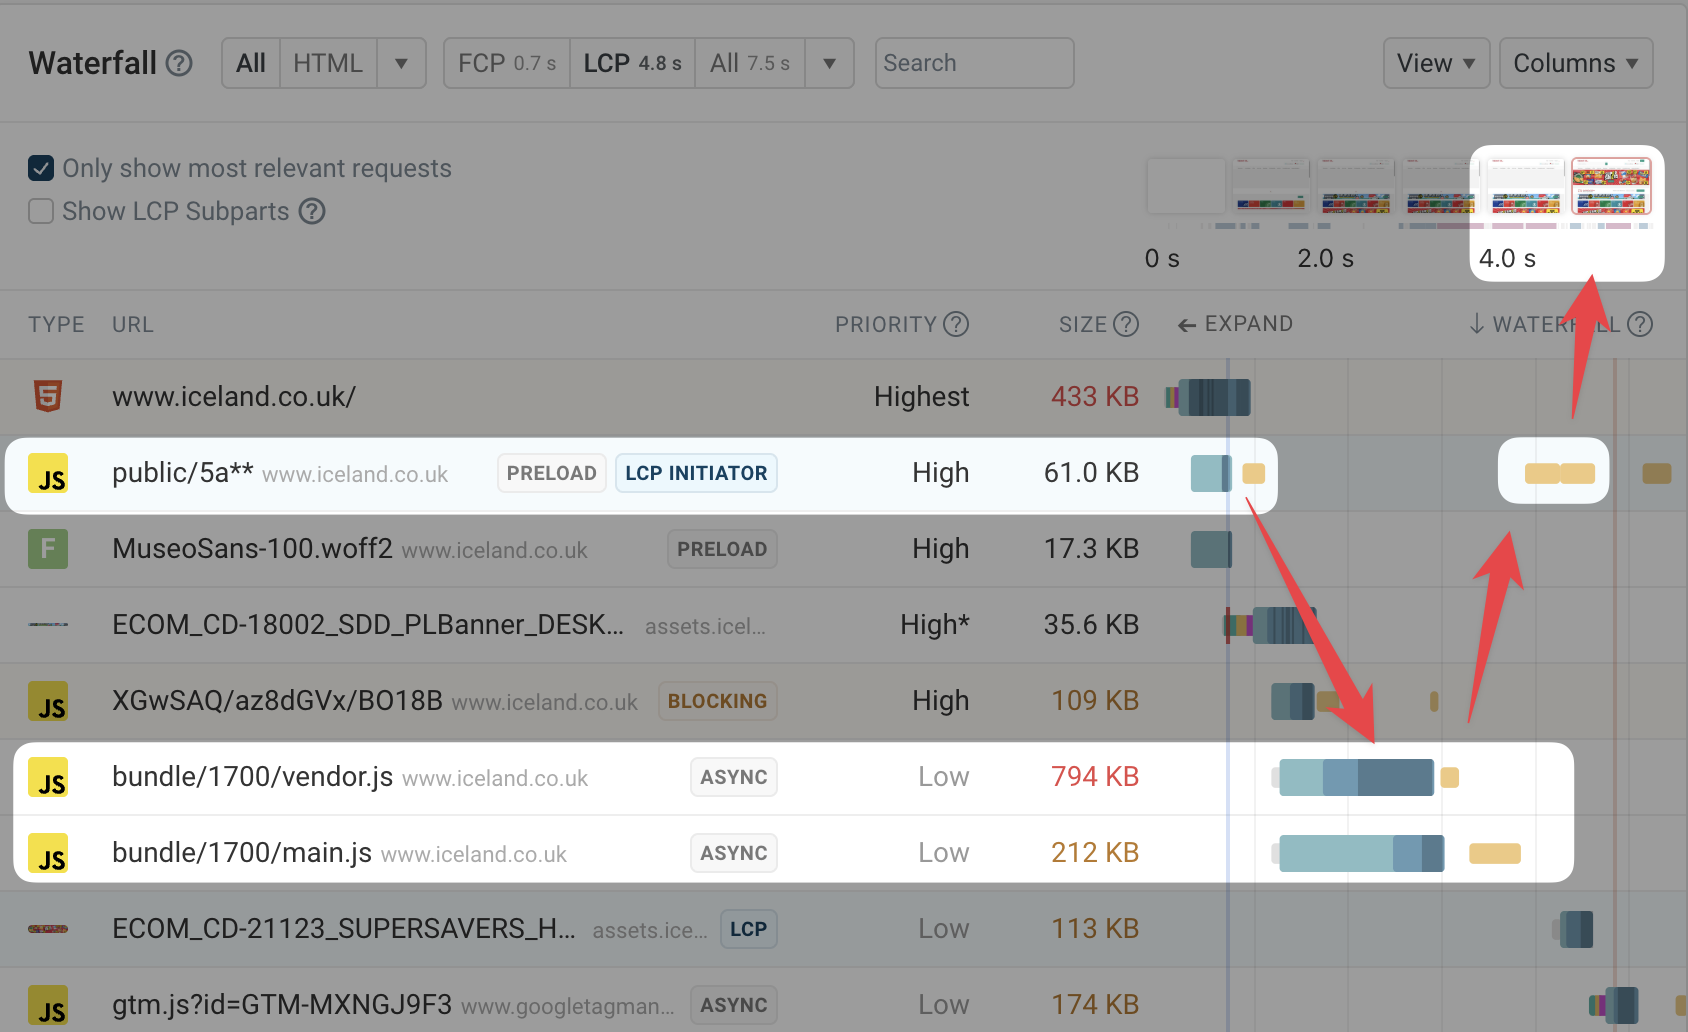
Synthetic testing can provide a detailed analysis of how resources are loading during the initial page load and how that impacts what users can see on the page.
For example, here we can see a request waterfall for a single page application:
- Some content is server-side rendered and appears quickly
- Multiple JavaScript bundles load in sequence before the full content renders
Identify layout shifts impacting real users
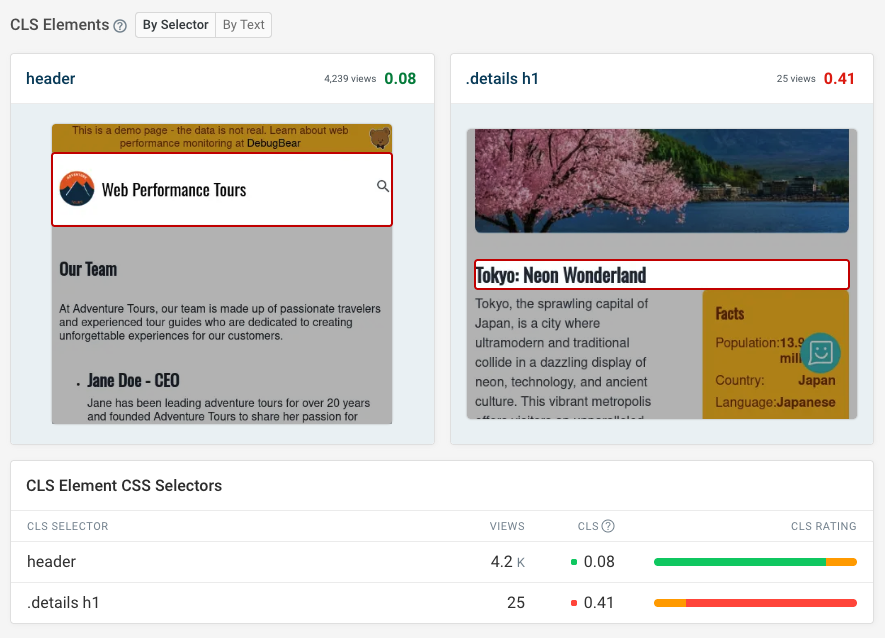
Cumulative Layout Shift scores often differ significantly between lab tests and real user data. Layout shifts frequently happen in response to a user interaction, or only apply on certain viewport sizes.
Real user data can help you see where users experience layout shift and how to replicate it. You can see:
- What elements shift on what pages
- What page URL the shift happened on (using CLS URL Path)
- Whether an interaction preceded the shift
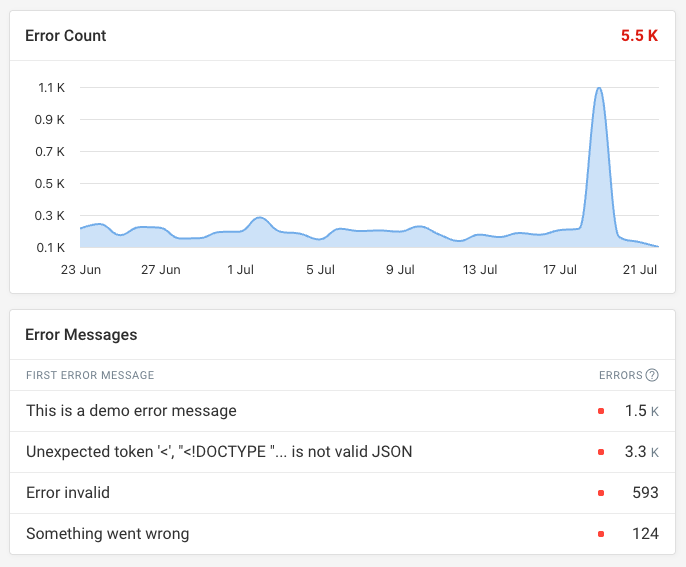
View page rendering errors
Single-page websites depend on JavaScript to function, and even to load in some cases. If a bundle fails to load or an exception is thrown while rendering, the visitor can end up looking at a blank page. Because no server round trip is involved, nothing in your backend logs will record that it happened.
Tracking JavaScript errors lets you see what errors occur on your website and what pages they happen on. That page breakdown matters in an SPA, where an error that breaks one route often leaves the rest of the app working normally, so it can go unreported for a long time.
Conclusion
Measuring and monitoring single-page applications comes with specific challenges. Browser standards have caught up somewhat now that Chrome reports Core Web Vitals for soft navigations, but coverage is still limited to Chromium browsers.
A web performance monitoring tool like DebugBear can help you gain better insights into what parts of your app are causing problems for your visitors and what you can do about it.
Monitor Page Speed & Core Web Vitals
DebugBear monitoring includes:
- In-depth Page Speed Reports
- Automated Recommendations
- Real User Analytics Data