
React apps tend to slow down as they grow. Components re-render unnecessarily, bundles bloat, and interactions start to lag. The results are poor Core Web Vitals (especially Interaction to Next Paint), frustrated users, and a sluggish user experience.
While React apps are notable for performance issues, and there are now more lightweight alternatives for component-based applications (e.g., Preact, Lit, Solid, etc.), React also continues to add new performance features that expand the options for building fairly well-performing applications using this framework.
In this post, we'll look into how to measure and optimize React performance.
How to Measure React Performance
Effective performance optimization starts with measurement. React provides some ways to measure application performance using browser developer tools so that you can identify performance bottlenecks and unnecessary re-renders.
1. React Performance Tracks
React Performance Tracks were introduced in React 19.2. They are custom timeline entries in Chrome DevTools' Performance panel that show React-specific events alongside network requests and JavaScript execution.
Essentially, they visualize React's internal priority system alongside component render durations and server activity, providing a comprehensive view of React's concurrent rendering functionality.
React Performance Tracks appear in three distinct sections within the Performance panel:
-
Scheduler track, which shows React's internal work scheduling across four subtracks: Blocking, Transition, Suspense, and Idle. Each subtrack uses colored bars to represent work at different priority levels (e.g., blocking priority for user input or transition priority for updates wrapped in
startTransition). If you're dealing with sluggish interactions, the Scheduler track helps you understand whether React is actively processing tasks or waiting. -
Components track, which visualizes the component tree in a flame chart as React renders components and executes effects. You'll see labels for events such as Mount (when components are first rendered) and Unmount (when components are removed). Color intensity reflects render duration, with darker shades indicating relatively slower renders. This can help you quickly identify performance bottlenecks in your component tree.
-
Server tracks, which show Server Components and Server Requests in development builds if you use React Server Components. These tracks capture server-side rendering activity, including streaming and hydration, and are useful for debugging SSR performance issues.

In development builds, React Performance Tracks appear automatically. In profiling builds, the Scheduler track appears by default, while the Components track only shows components wrapped in <Profiler> unless you have React Developer Tools installed.
To use Performance Tracks, open Chrome DevTools, go to the Performance tab, and click the Record button. Interact with your app, then stop recording. The tracks will appear in the timeline alongside other browser events.
2. React Developer Tools Profiler
React Developer Tools is a browser extension available for Firefox and Chromium-based browsers (Chrome, Edge, Opera, etc.). It adds two tabs to DevTools: Components and Profiler.
The Profiler tab measures component render performance. To record performance data, open the Profiler tab, click the Record button, and interact with your app. When you want to stop recording, click the Record button again. React Developer Tools will generate a flame chart showing which components rendered during the session.
How to Read the Flame Chart
The flame chart displays components hierarchically. Parent components appear at the top, while their children are shown below them. Each bar's width represents how long that component (and its children) took to render. Color coding makes bottlenecks obvious:
- Gray bars: Components that didn't render during this commit*
- Green/teal bars: Fast renders
- Yellow/orange bars: Slower renders (these are your optimization targets)
In React, a commit refers to the phase when updates (calculated during the render phase) are applied to the DOM. A recording session typically captures multiple commits (e.g., 23 in the screenshot below).
The colored bars at the top of the Profiler tab show all commits from your recording session. By clicking a bar or using the arrow buttons, you can navigate between commits and compare their performance:

How to Check Why Components Rendered
React Developer Tools can also show exactly why each component rendered. This eliminates guesswork when debugging unnecessary re-renders. To use this feature, you need to enable the 'Record why each component rendered while profiling' option in the Profiler settings (click the gear icon inside the Profiler tab).
After profiling, hover over a component in the flame chart. A tooltip under the 'Why did this render?' heading will now display the reason the component rendered (e.g., props changed, state changed, parent component rendered, etc.):

3. Profiler Component API
React's Profiler component allows you to measure rendering performance programmatically. You can wrap it around any part of your component tree to track render timing. For example:
import { Profiler } from "react";

function App() {
  const handleRender = (
    id,
    phase,
    actualDuration,
    baseDuration,
    startTime,
    commitTime,
  ) => {
    console.log({
      id,
      phase,
      actualDuration,
      baseDuration,
      startTime,
      commitTime,
    });
  };

  return (
    <Profiler id="App" onRender={handleRender}>
      <Navigation />
      <MainContent />
    </Profiler>
  );
}
The onRender callback fires every time the wrapped components render, providing timing data such as render duration and phase. You can use this data to identify slow renders during development or track performance metrics over time.
4. Chrome DevTools Performance Tab
In addition to React Performance Tracks, Chrome DevTools' Performance tab includes general profiling tools that show all browser activity.
The Main section appears below React Performance Tracks. It visualizes the main thread timeline, showing when JavaScript execution occurs. This includes both your application code (such as custom components like DataProcessor, ChartRenderer, and ChartGrid in the screenshot below) and React's internal rendering functions. Wider blocks indicate functions that took longer to execute:

In the bottom pane, the Call Tree tab breaks down CPU time by function, showing Self Time (time spent in the function itself) and Total Time (including time spent in all child functions) for each entry. Keep in mind the call tree includes all JavaScript execution, not just React components, so you'll need to identify React-specific work within the broader execution trace.
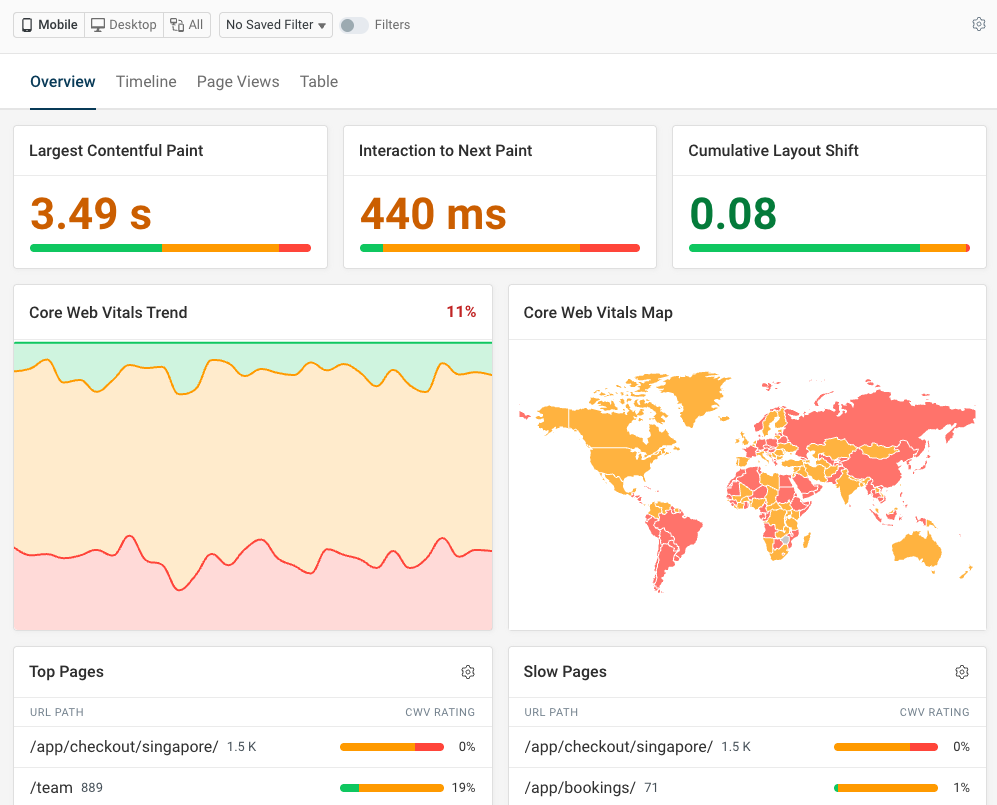
5. Real User Monitoring (RUM)
Real user monitoring provides a higher-level overview of Core Web Vitals on your website React app. You can measure load time, visual stability, and interaction responsiveness.
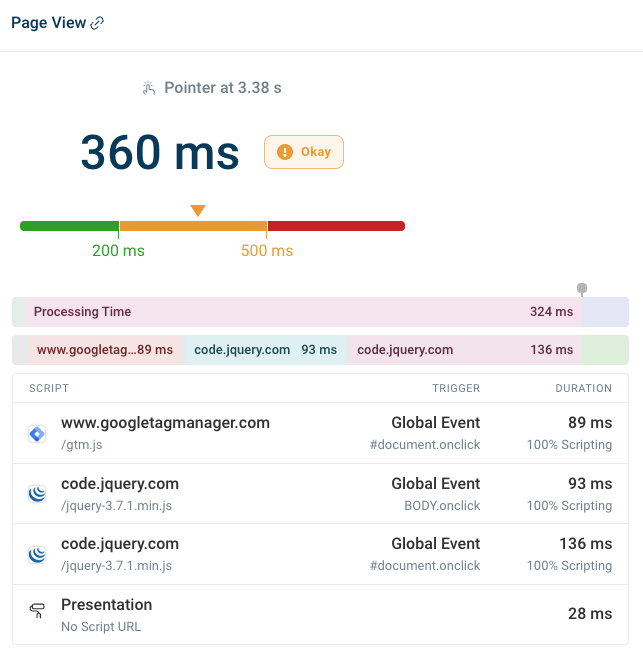
You can also review specific slow scripts to see whether delays come from your own React app or third-party code like analytics.
During a slow interaction, scripts may be running because hydration is taking place in the background, or because React is processing updates.
How to Optimize React Performance
Once you've identified bottlenecks using the above tools, you can start optimizing your React app for performance. Focus on what has real user impact, such as improving INP scores, speeding up load times, and reducing long tasks.
1. Runtime Optimizations
Runtime optimizations improve React performance while your app is running. You can use the below techniques when profiling reveals unnecessary re-renders or expensive component updates.
1.1. Memoization
Memoization caches computation results to avoid redundant work. With memoization, React returns the cached result instead of recalculating it when inputs haven't changed.
There are three ways to memoize in React:
memo()– memoizes componentsuseMemo()– memoizes valuesuseCallback()– memoizes functions
Let's briefly see how they work.
1.1.1. memo()
With the memo() function, you can memoize components to prevent re-renders when props haven't changed. You simply need to wrap it around the component declaration in the following way:
import { memo } from "react";

const MyComponent = memo(({ data, onAction }) => {
  return <div onClick={() => onAction(data.id)}>{data.value}</div>;
});
While memo() is useful for components, it performs a shallow comparison of props, meaning it compares each prop by reference. Objects and functions created inline in the parent component get new references on every render, so to maintain stable references, you'll need to use:
useMemo()for objects/arraysuseCallback()for functions
1.1.2. useMemo()
With the useMemo() hook, you can memoize computed values to avoid recalculation or keep object/array references stable across renders, for example:
import { useMemo } from "react";

function MyComponent({ items, filter }) {
  const filteredItems = useMemo(() => {
    return items.filter((item) => item.category === filter);
  }, [items, filter]);

  return <ChildComponent items={filteredItems} />;
}
Avoid useMemo() for inexpensive operations such as simple arithmetic or accessing properties. As the hook itself has overhead, it's better to compute these values directly. Reserve useMemo() for heavy computations, large array operations, or values passed to memoized children.
1.1.3. useCallback()
You can memoize functions with the useCallback() hook to prevent them from being recreated on every render:
import { useCallback } from "react";

function MyComponent({ items, onItemSelect }) {
  const handleClick = useCallback(
    (id) => {
      onItemSelect(id);
    },
    [onItemSelect],
  );

  return <ChildComponent items={items} onClick={handleClick} />;
}
Without useCallback(), functions get new references on each render, breaking child memoization. Any child component receiving handleClick() would re-render every time, even if the function's behavior hasn't changed.
1.2. Code Splitting
You can split your React code into smaller chunks and load components on demand using lazy() and <Suspense>. The lazy() function defers loading until the component is needed, while the <Suspense> component shows a fallback UI during loading.
Here's a simple example:
import { lazy, Suspense } from "react";

const MyComponent = lazy(() => import("./MyComponent"));

function App() {
  return (
    <Suspense fallback={<div>Loading...</div>}>
      <MyComponent />
    </Suspense>
  );
}
1.3. List Virtualization
List virtualization (also called "windowing") is a React performance optimization technique for rendering numerous (~100+) similar items or complex ones (e.g., cards with images, charts, or multiple child components). Long lists hurt web performance because the browser renders every item, including off-screen ones.
While you can implement virtualization manually, libraries such as react-window are well-tested and eliminate common pitfalls such as scroll jank, incorrect positioning, and memory leaks.
In the code example below, react-window only renders ~12-15 items at a time (600px / 50px visible area, plus a small buffer):
import { FixedSizeList } from "react-window";

function MyComponent({ items }) {
  return (
    <FixedSizeList
      height={600}
      itemCount={items.length}
      itemSize={50}
      width="100%"
    >
      {({ index, style }) => (
        <div key={items[index].id} style={style}>
          {items[index].name}
        </div>
      )}
    </FixedSizeList>
  );
}
While the react-window library adds ~4-5 KB to your bundle, it eliminates rendering overhead for large lists by avoiding unnecessary DOM nodes (e.g., for a 1,000-item list, you render only the visible items instead of all 1,000). Still, only use it if profiling reveals list rendering as a bottleneck.
1.4. State Management
React re-renders components along with all of their children when state updates occur, so state placement directly affects your application's performance.
State colocation is a React performance optimization technique that keeps state as close as possible to where it's used. Avoid lifting state to a parent component unless it needs to be shared:
// Bad: state in parent causes all siblings to re-render
function MyComponent() {
  const [value, setValue] = useState("");
  return (
    <>
      <Child1 value={value} onChange={setValue} />
      <Child2 />
      <Child3 />
    </>
  );
}

// Good: state isolated to the component that needs it
function Child1() {
  const [value, setValue] = useState("");
  // ...
}
When you do need to share state across multiple components, lift it only to the closest common ancestor to minimize unnecessary re-renders and avoid excessive prop drilling.
Alternatively, you can use the Context API, which allows you to share state across components without prop drilling. However, be cautious as the Context API can cause unnecessary re-renders. This happens because every component consuming a context re-renders when the context value changes, regardless of whether that component actually uses the changed portion of the value.
You can mitigate this by splitting contexts (i.e., creating separate contexts for different pieces of data), or using a state management library with built-in selector optimization, such as Zustand or Jotai, both of which are fairly lightweight. These libraries let components subscribe to only the specific parts of state they need, preventing unnecessary re-renders when unrelated state changes.
2. Concurrency Features
React 18 introduced concurrent rendering capabilities that can help you maintain responsiveness during heavy updates. Concurrent rendering allows you to keep the UI interactive while React is processing expensive operations, such as filtering large datasets or rendering complex components.
You can use two React hooks to manage update priority:
useTransitionto mark your own state updates as non-urgentuseDeferredValueto defer values you receive as props
Both keep urgent updates responsive while processing deferred updates in the background.
Let's briefly see how they work.
2.1. useTransition
With useTransition, you can mark non-urgent updates so that React prioritizes more important updates first. The state update will still happen immediately, but React may pause or restart the associated rendering work.
The useTransition hook returns two values:
isPending– a boolean indicating if the transition is in progressstartTransition()– a function for wrapping low-priority updates
In the code example below, you can see how useTransition can be used to speed up filtering in a large data table:
function DataTable() {
  const [searchText, setSearchText] = useState("");
  const [filteredRows, setFilteredRows] = useState(allRows);
  const [isPending, startTransition] = useTransition();

  const handleChange = (text) => {
    // Urgent: update input immediately
    setSearchText(text);

    startTransition(() => {
      // Non-urgent: update table when possible
      const filtered = allRows.filter((row) => row.name.includes(text));
      setFilteredRows(filtered);
    });
  };

  return (
    <>
      <input
        value={searchText}
        onChange={(e) => handleChange(e.target.value)}
      />
      <table>
        {filteredRows.map((row) => (
          <tr key={row.id}>{row.name}</tr>
        ))}
      </table>
    </>
  );
}
There are two competing updates in this example:
- the search input
- the filtered table rows
Typing into the search input must feel instant for the user, however re-rendering thousands of rows can wait. To prioritize the updates, we add the startTransition() wrapper around the non-urgent update. This way, users get immediate feedback even when the table has thousands of rows to filter.
Without useTransition, React would process both updates with the same priority, making the input feel sluggish until the table re-render completes.
2.2. useDeferredValue
You can use the useDeferredValue hook when you need to defer a value received from props or external sources. This can be useful when you don't have direct control over the state update (e.g., when a parent component manages the state).
In the following example, filterText comes from a parent component. By deferring it, React can prioritize keeping user input responsive over updating the table:
function DataTable({ filterText }) {
  const deferredFilter = useDeferredValue(filterText);

  const filteredRows = useMemo(() => {
    return allRows.filter((row) => row.name.includes(deferredFilter));
  }, [deferredFilter]);

  return (
    <table>
      {filteredRows.map((row) => (
        <tr key={row.id}>{row.name}</tr>
      ))}
    </table>
  );
}
As you can see above, useDeferredValue defers filtering, so the UI can stay responsive while the user is typing into the input field. We also wrapped the filtering logic in useMemo (see above) to ensure it only recalculates when deferredFilter changes, avoiding unnecessary recomputation on every render.
Use useTransition when you're updating state directly, and useDeferredValue when you receive values from props or third-party libraries.
3. Bundle Size
JavaScript bundle size directly impacts page load times. Larger bundles result in longer downloads, more parsing work, and delayed interactions, especially on mobile devices and slower networks.
Chrome Lighthouse provides a Treemap view that can help visualize bundle composition. After running a Lighthouse audit in Chrome DevTools, click the View Treemap button to inspect how your JavaScript is structured.
Note that bundle composition of development builds can be misleading because they lack minification, tree shaking, code splitting, and other optimization techniques implemented during the build process. On the other hand, in production builds, the treemap typically reflects bundler chunks rather than individual packages unless you have enabled source maps in your build tool's configuration file.
You can enable source maps in the following way in different build tools (see documentation for Vite, Webpack, esbuild):
// Vite (vite.config.js)
build: {
  sourcemap: true;
}

// Webpack (webpack.config.js)
devtool: "source-map";

// esbuild (CLI)
--sourcemap;
For deeper analysis, you can use a dedicated bundle analyzer, such as Webpack Bundle Analyzer or Rollup Plugin Visualizer (the latter also works with Vite). Both tools generate interactive treemaps showing which dependencies contribute most to your bundle size. You'll often find surprising things such as a date library adding 300 KB or a heavy UI framework that could be replaced with a more lightweight alternative.
To reduce bundle size, a good rule of thumb is to import only what you need. Even tree-shakable libraries can significantly increase bundle size if they provide convenience entry points that load everything by default. A common example is the Chart.js library. Importing from the chart.js/auto entry point eagerly registers all chart controllers, scales, elements, and plugins in Chart.js:
import Chart from "chart.js/auto";
While this approach ensures that all charts work out of the box, it also means that all chart types are imported and registered at runtime, forcing the bundler to include them even if they are never used.
Tree shaking works best when unused code is never imported in the first place. For example, the below code only imports and registers the components needed for bar charts:
import {
  Chart as ChartJS,
  BarController,
  BarElement,
  CategoryScale,
  LinearScale,
} from "chart.js";

ChartJS.register(BarController, BarElement, CategoryScale, LinearScale);
4. Server-Side Rendering
Server-side rendering (SSR) can significantly improve React performance by sending pre-rendered HTML that the browser only needs to hydrate, instead of rendering the entire application from scratch on the client side. This allows users to see meaningful content sooner and typically improves First Contentful Paint (FCP) and Largest Contentful Paint (LCP).
Streaming SSR
Since React 18, SSR is no longer limited to rendering the entire page in a single pass. React apps can now be rendered on the server incrementally:
- The
renderToPipeableStreamAPI allows the server to stream HTML to the browser in chunks as components finish rendering. This means above-the-fold content can be delivered first, while data-heavy sections stream in later, enabling the browser to start parsing and painting sooner. - The
<Suspense>component lets you define where rendering can pause and resume while displaying a fallback UI. On the server, it enables selective streaming and incremental content reveal. On the client, it allows rendering to be deferred during hydration.
While these two techniques are often used together, they solve different problems. Streaming controls how HTML is sent to the browser, while <Suspense> controls where rendering may pause and resume. Either can be used independently, however. The renderToPipeableStream API can progressively send HTML without <Suspense>, and <Suspense> can be used without streaming to defer rendering on the client (as we discussed in the Code Splitting section above).
React Server Components (RSC)
React 18 also introduced React Server Components, which take a different approach by moving the rendering of non-interactive components (i.e., those without client-side state or effects) to the server. Since Server Components never run in the browser, they ship no JavaScript, and no hydration is required for them.
Unlike full SSR, which sends HTML that must be hydrated on the client, RSCs send a serialized representation of the component tree that React's client runtime reconstructs and merges with (interactive) Client Components. Note that RSCs were designed to complement Client Components rather than replace or supersede them.
5. React Compiler
React Compiler is a build-time optimization tool that automatically adds memoization to React components, often eliminating the need for adding useMemo, useCallback, and React.memo() manually. It's not part of React core; you need to add it as a Babel plugin to your build pipeline. React Compiler became stable in October 2025.
It works out of the box without any configuration (however, you can configure it if you want). React Compiler analyzes component code at build time and inserts memoization wherever it can safely improve performance. Unlike manual memoization, the compiler can apply memoization more precisely, including to individual expressions and conditional render paths.
This approach relies on the assumption that components are pure (i.e., the same inputs produce the same output and don't perform side effects during render). As a result, React Compiler requires code to follow the Rules of React, meaning props and state can't be mutated, and Hooks must be used correctly.
While React Compiler makes common performance optimizations automatic and consistent, compiler-generated memoization can make debugging less transparent, plus impure or legacy code may see little to no benefit.
To practice how to optimize React performance, check out the Slow React GitHub repo, built by our reader Manuel Paulo Afonso, who was inspired by this article. Slow React covers the performance optimization techniques discussed above using a Pokémon analogy. Clone it locally, and use React Developer Tools to analyze and solve the performance issues deliberately left in the code.

How to Monitor Your React App in Production
Development tools only measure performance in your local environment; however, you may also want to see how your React app performs in production.
The best way to do that is by setting up a real user monitoring (RUM) tool so that you understand how your actual users interact with your app and what performance issues they encounter. Since React performance tends to degrade over time, you'll always encounter surprises, even if you have a well-configured app.
DebugBear RUM shows your most important page load milestones as histograms, along with other essential real user metrics:

You can also set up performance budgets, which alert you whenever a specific performance metric (e.g., a Core Web Vital) exceeds a preset threshold during your automated lab tests:

To get started with optimizing React performance, sign up for a free 14-day trial and identify your key issues.


Monitor Page Speed & Core Web Vitals
DebugBear monitoring includes:
- In-depth Page Speed Reports
- Automated Recommendations
- Real User Analytics Data