We've been working on making it easier to measure the business impact of performance, and analyze your synthetic test results.
View how performance impacts conversion rates
If you opt into conversion tracking, you can see what pages a visitor opens in their sessions and correlate conversion events with web performance metrics.
That way you can measure the business impact of improving your web performance.

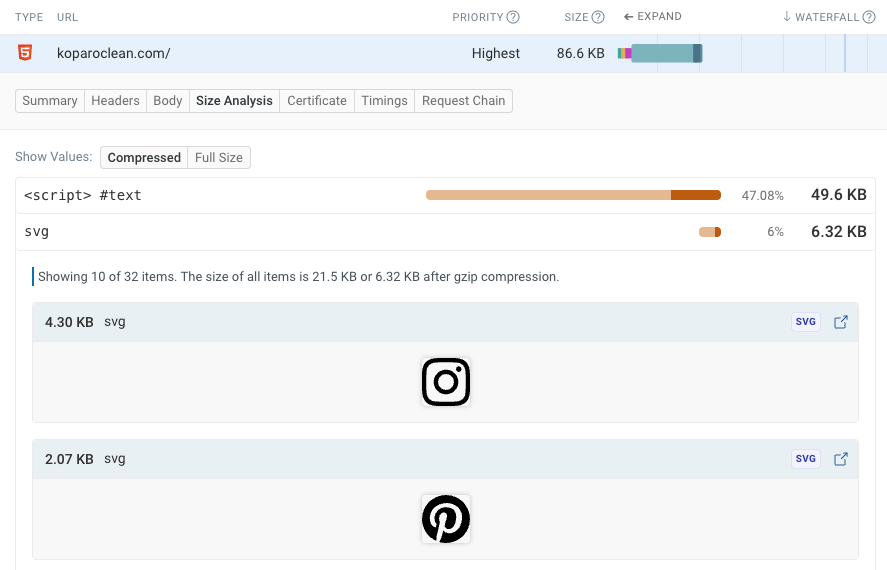
Improved HTML Size Analysis
Our HTML Size Analyzer has a new design and improved functionality. You can find it built into our product by expanding the HTML request and switching to the "Size Analysis" tab.
Track synthetic INP scores
Last month we started measuring Interaction to Next Paint as part of scripted interactions. Now you can track these metrics over time.

View CrUX data across desktop and mobile
Our CrUX trends dashboard now lets you view data across all devices. Plus, we've added an x-axis!

Use wildcards when collecting custom metrics
DebugBear RUM lets you collect custom metrics in addition to the pre-defined performance metrics. When collecting values like the start time or duration of a request you can now use wildcards (*) in the request URL match value.

Updated lab test comparison view
When investigating regressions or running page speed experiments, you can now more easily see how your metrics have changed.
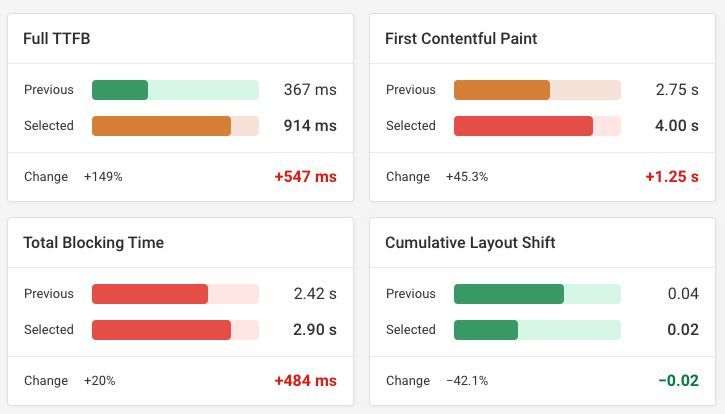
Click the "Compare" toggle in the top right of your page view monitoring results to view before and after scores.
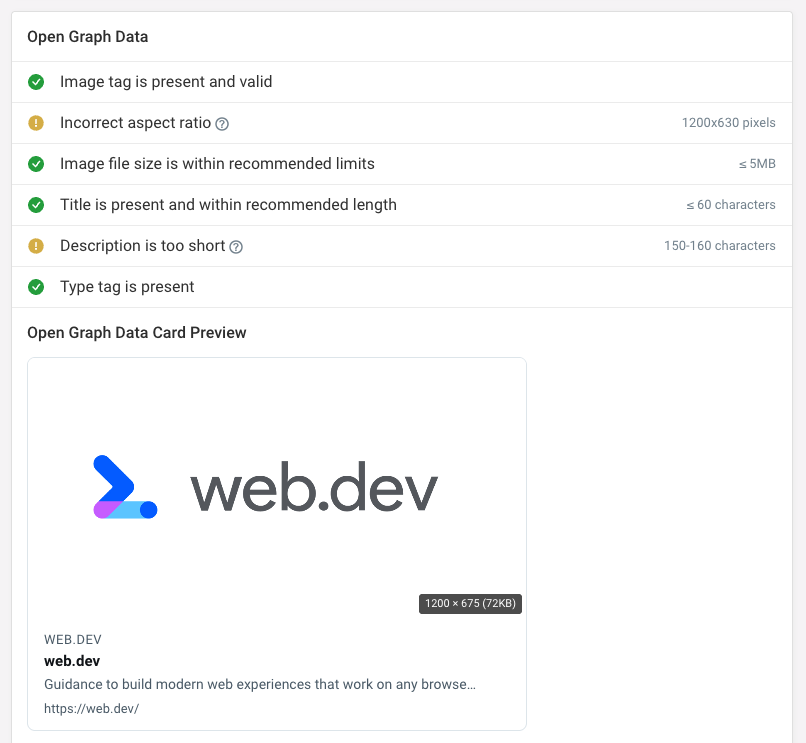
Free Website SEO Checker
We've launched a new free tool: the website SEO checker. Quickly run Lighthouse SEO audits, analyze page headings, and validate your Open Graph tags.
New articles
We've been working on new guides to help you improve your web performance!
- Effectively Monitoring Web Performance: Develop a high-level strategy for identifying issues, finding solutions, and setting up monitoring to keep your site fast for the long term.
- Calendly Booking Links: A Web Performance Audit: A look at a real-world website and what's slowing it down.
- How To Debug JavaScript In Chrome DevTools: A deep dive into Chrome's JavaScript debugger, from the basics to advanced techniques.