
Soft navigation reporting lets you measure Core Web Vitals and other metrics for the dynamic URLs used in single page applications (SPAs). Support for this shipped in Chrome 151 in August 2026.
In this tutorial, we’ll look into how you can report Core Web Vitals from a React application to the console.
To learn more about soft navigation reporting and Core Web Vitals, check out our article on the subject which discusses the theoretical background and the details of the technical implementation.
Prerequisites
You’ll need the following to set up soft navigation reporting in a React application:
- a working React app
- the Chrome browser
- Node.js and npm (Node.js package manager) installed on your computer
I’ll use a basic task tracker app built with the Create React App tool. Create React App has since been deprecated in favor of framework-based setups like Next.js and Vite, but the reporting code below doesn’t depend on it. The only part specific to Create React App is the reportWebVitals.js file, and you can call the same web-vitals functions from anywhere in your app. The application is an enhanced version of Brad Traversy’s demo app used in his React crash course (I’ll refer to it as ‘demo app’ throughout the tutorial).
We’ll also use Google’s web-vitals.js library, which we’ll add as an npm package to the project. Soft navigation reporting was developed on a separate soft-navs branch and has since been merged into the main library, so the regular package is all you need.
Below, you can see a screenshot of the demo app we’ll use throughout the tutorial:

Examples of Soft Navigations in the Demo App
First, let’s see which links and actions qualify as soft navigations in the demo application.
Every dynamic URL change that’s visible in the browser’s address bar counts as a soft navigation. In the demo app that means clicking the links in the footer menu, as well as the browser’s Back and Forward buttons.
Other clicks, such as the ‘Close’ and ‘Save Task’ buttons, don’t qualify as soft navigations because neither the URL nor the browser history changes.
The screenshot below shows how Chrome reports this in the console once soft navigation reporting is switched on, which is what the next step covers:

1. Show Hard Navigations in the Console
You can also show hard navigations in the console by enabling the Preserve log console feature.
This can be useful if you want to see the difference between hard navigations (static, triggered by HTML) and soft navigations (dynamic, triggered by JavaScript). Without the preserve log feature enabled, the console clears when a hard navigation (e.g. a page reload) happens. When it’s enabled, it reports a ‘Navigated to [URL]’ message to the console on every hard navigation.
Enable it by clicking the small gear icon in the top-right corner of the Console tab to open the console’s settings, then check the Preserve log option:

Chrome DevTools now reports both soft and hard navigations to the console:

2. Adding the web-vitals Library to the React App
Now, it’s time to add the web-vitals library to the React application.
By default, the Create React App adds an older version (v2.1.4) of the library to the project, which predates soft navigation support. Installing the current version updates it to one that can report soft navigations.
Open your command line and run the following command:
npm install web-vitals
The new addition should appear in your package.json file among your dependencies as follows:
"dependencies": {
  "web-vitals": "^6.2.1"
}
Your version number will differ depending on when you install the package.
3. Report Largest Contentful Paint for Soft Navigations
The web-vitals library can report five metrics: Time to First Byte, First Contentful Paint, Largest Contentful Paint, Cumulative Layout Shift, and Interaction to Next Paint.
Let’s start with only Largest Contentful Paint (LCP) to make it easier to read the console log.
In your React app, you’ll have to edit two files (assuming it was created with the Create React App library):
src/reportWebVitals.js(see the source file on GitHub)src/index.js(see the source file on GitHub)
Note that since the third major release (v3) the web-vitals library uses a different syntax than the earliest versions: the method names changed from getLCP, getCLS, etc. to onLCP, onCLS, etc.
To add soft navigations to the Largest Contentful Paint reporting performed by the web-vitals library, change your reportWebVitals.js file as follows (now it will report both soft and hard navigations for LCP):
const reportWebVitals = (onPerfEntry) => {
  if (onPerfEntry && onPerfEntry instanceof Function) {
    import("web-vitals").then(({ onLCP }) => {
      onLCP(onPerfEntry, { reportSoftNavs: true });
    });
  }
};

export default reportWebVitals;
To make the LCP values appear in the console, add the following line to the end of the src/index.js file:
reportWebVitals(console.table);
I’ve used the console.table method above as it reports the log data in an easy-to-read table format, but console.log or console.trace work just as well.
In the screenshot below, you can see how Largest Contentful Paint has been reported to the console for hard and soft navigations (note that sometimes you need to wait for a few seconds until the data appears in the console):

The first result is a static (hard) navigation, which was reported when I reloaded the React app (its navigationType is reload). Its LCP value is 150.6 milliseconds, which gets the ‘good’ rating.
The second result is a dynamic (soft) navigation, which was reported when I clicked the ‘Contact’ footer link inside the application (its navigationType is soft-navigation). As could be expected, it has a much lower LCP value (46.69 milliseconds) than the hard navigation because the single page application was already loaded in the browser.
5. Report Soft Navigations for All the Web Vitals
If you want to add soft navigation reporting to all the available Web Vitals, change the code in the reportWebVitals.js file as follows:
const reportWebVitals = (onPerfEntry) => {
  if (onPerfEntry && onPerfEntry instanceof Function) {
    import("web-vitals").then(
      ({ onTTFB, onFCP, onLCP, onCLS, onINP }) => {
        onTTFB(onPerfEntry, { reportSoftNavs: true });
        onFCP(onPerfEntry, { reportSoftNavs: true });
        onLCP(onPerfEntry, { reportSoftNavs: true });
        onCLS(onPerfEntry, { reportSoftNavs: true });
        onINP(onPerfEntry, { reportSoftNavs: true });
      }
    );
  }
};

export default reportWebVitals;
Depending on which metrics you want to collect, remove the respective lines from the code snippet above.
Conclusion
In this tutorial, we looked into how you can add soft navigation reporting for Web Vitals to a React app, but you can implement it in any other JavaScript UI framework, or in plain JavaScript.
Adding soft navigation reporting to your React or other single page application can help you:
- better understand how Web Vitals change as people are using your application
- make your SPA less of a black box performance-wise
- identify performance issues and improve the user experience
Logging metrics to the console tells you what’s happening in your own browser. To see how your app performs for real visitors, you need to collect the same data from them. And since soft navigation reporting only works in Chromium browsers, that data will cover your Chrome users rather than your whole audience.
DebugBear does this collection for you: enable Track SPA Soft Navigations Individually and each soft navigation is reported as its own page view, with paints, interactions, and layout shifts attributed to the page they happened on. Here an initial page load and three in-app navigations show up as four page views:
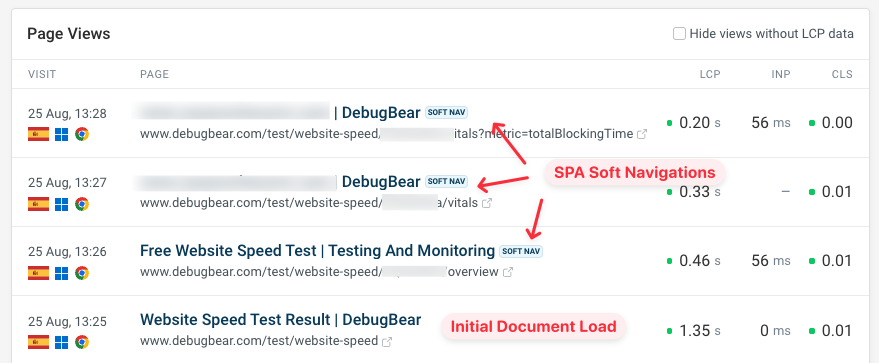
Our SPA monitoring guide covers the setting and how it affects your metrics. For more background, check out our article on the theoretical background of soft navigation reporting, too.
Monitor Page Speed & Core Web Vitals
DebugBear monitoring includes:
- In-depth Page Speed Reports
- Automated Recommendations
- Real User Analytics Data