
Chrome DevTools and Google Lighthouse now include enhanced layout shift debugging tools that make it easier to identify the causes of visual instability on your page.
In this article we'll explain how you can use this new performance insight to improve Cumulative Layout Shift scores for your website.
What are layout shifts?
A layout shift occurs when a visible element on the page changes position unexpectedly.
Chrome DevTools has had varying sets of features for layout shift debugging over the years, but the new tools provide a more intuitive view of layout shifts on your page.
Previously, you might have just seen a bunch of web page coordinates and a bunch of other numbers.
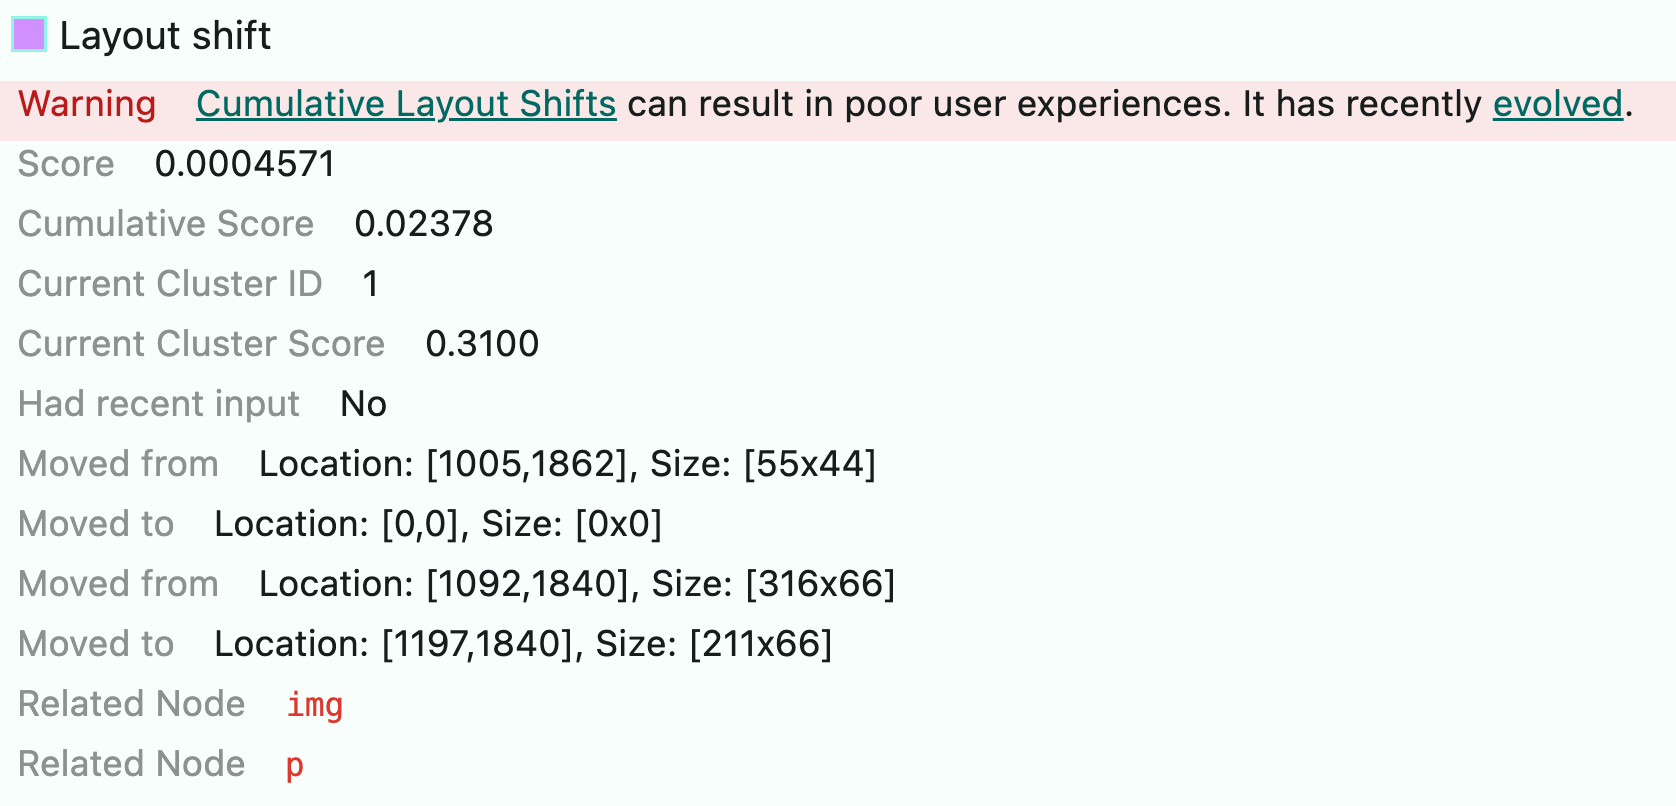
But now you can see a visual representation of the layout shift, which makes it much easier to understand what's going on.
How to view layout shift culprits
The list of layout shift culprits is available in either Lighthouse or Chrome DevTools.
Layout shift culprits in Lighthouse
When you run a test in Lighthouse or in a Lighthouse-based tool like PageSpeed Insights the test report shows the layout shift culprits data in the Performance category under Insights.
Here you can see:
- What element was impacted by the shift
- How much the shift contributed to your CLS score
- Sometimes a specific cause of the layout shift (like a web font or image loading)
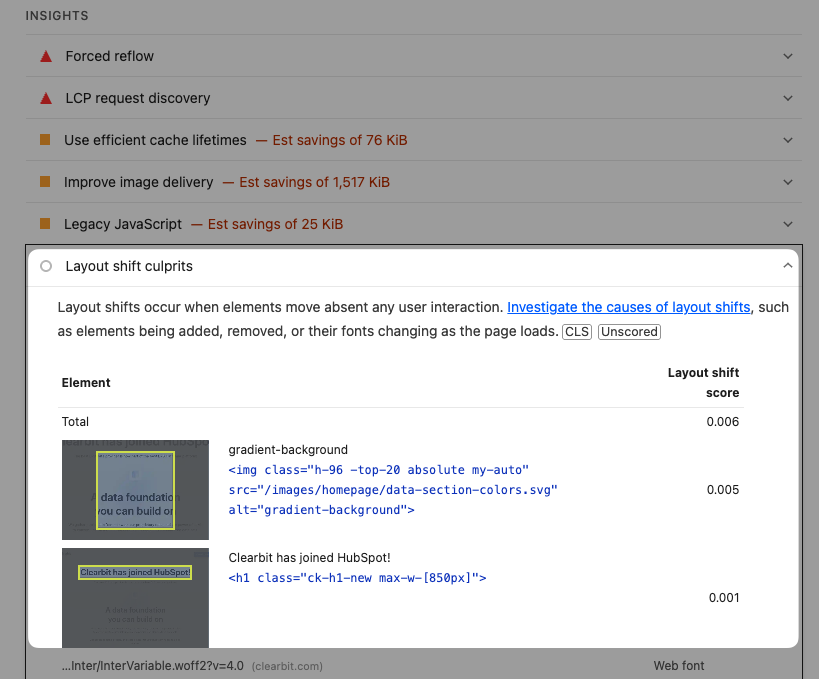
The audit also points out that layout shifts that happen soon after a user interaction don't increase the Cumulative Layout Shift score:
Layout shifts occur when elements move absent any user interaction. Investigate the causes of layout shifts, such as elements being added, removed, or their fonts changing as the page loads.
Layout shift culprits in DevTools
If you open up the Performance Insights sidebar (it's the Sidebar icon near the top left corner of DevTools) from a Performance Panel recording, you'll notice some new performance data.
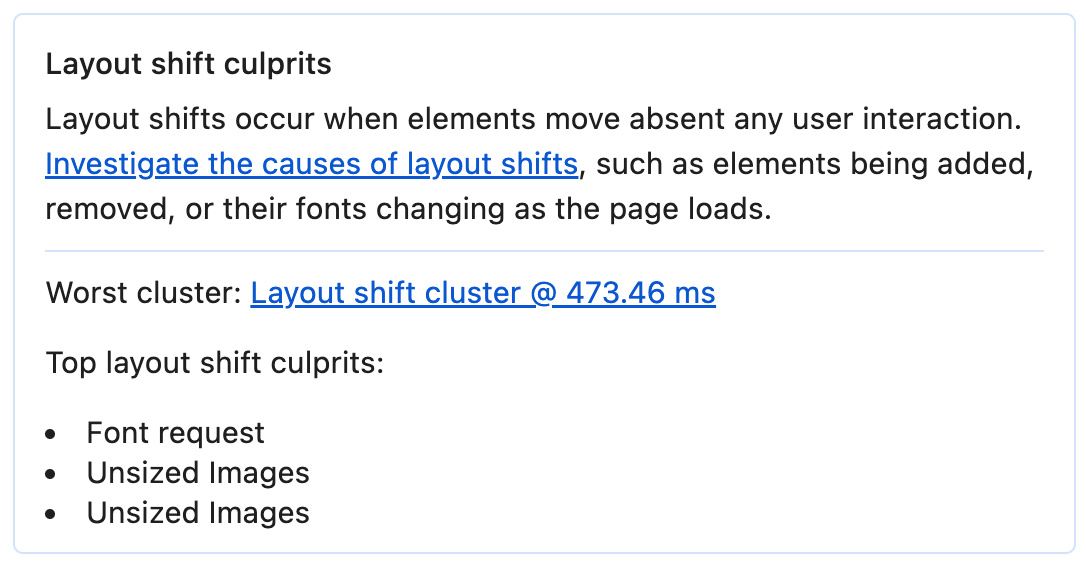
The Layout Shifts Culprits section links to a layout shift cluster that caused the most layout shifts in the recording, but also shows you the top layout shift culprits.
What's particularly useful is that the Performance Panel recording itself will then highlight with various annotations that give context to the layout shift. This is grouped with a "Worst layout shift cluster" label on the Performance Panel recording.
Layout shift cluster
In this example, there's a layout shift cluster which groups together multiple layout shifts that happen in quick succession.
This is useful because it helps you understand the context of the layout shift, and what might be causing it, as opposed to just seeing a bunch of layout shifts in isolation.
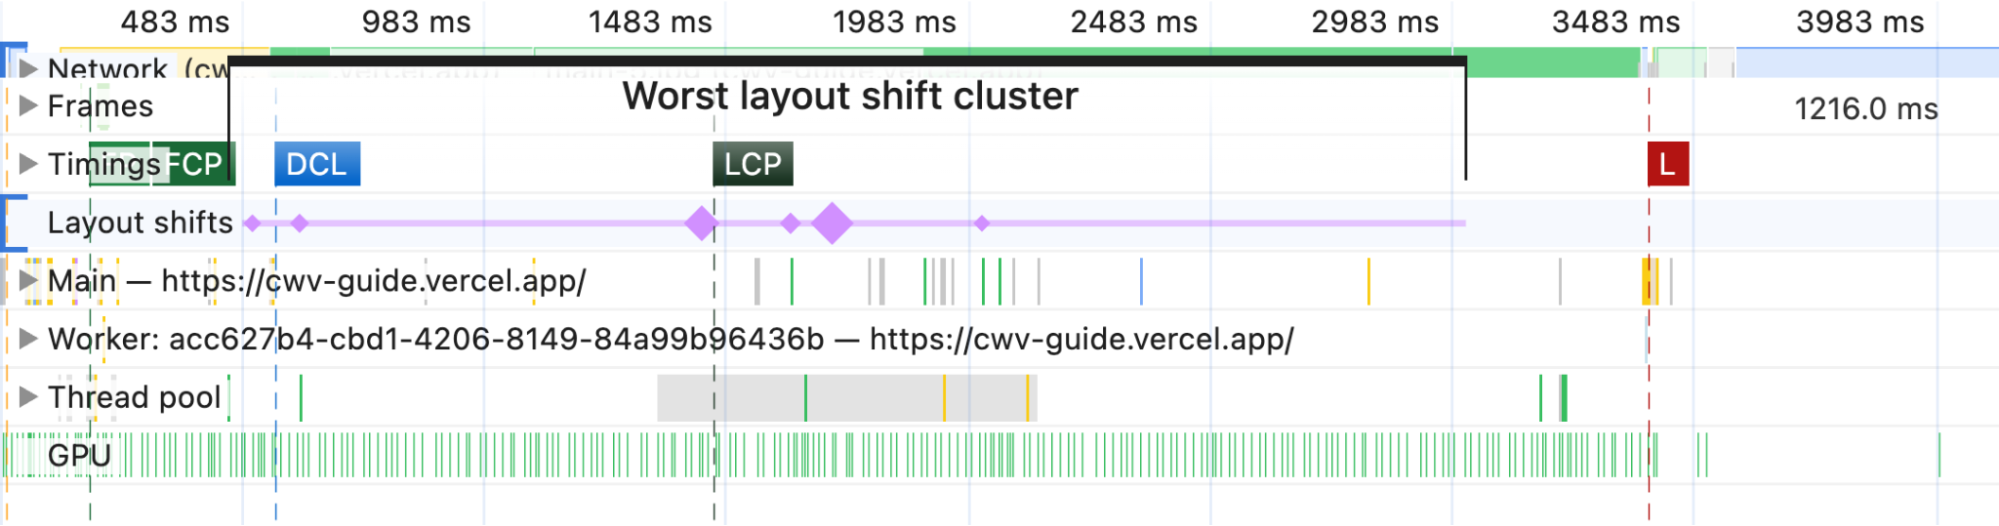
A layout shift cluster is a group of layout shifts that happen in quick succession, and as you hover over each layout shift, you see a visual representation of the layout shift, where the before and after states become clearer than plain old coordinates.
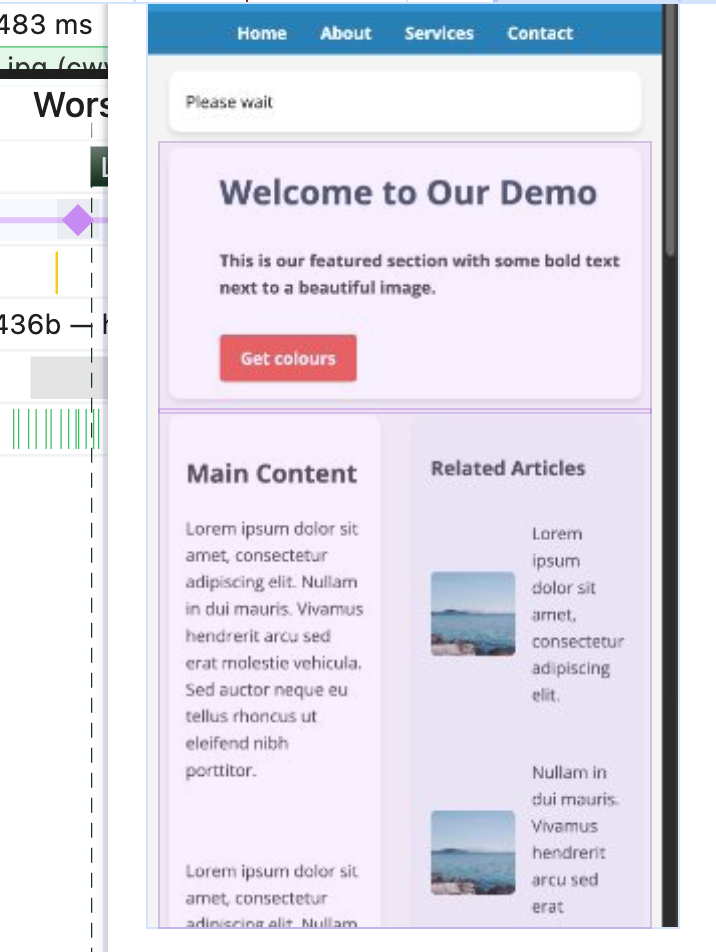
Since this information is present in this Performance Panel, you benefit from the usual Performance Panel features, such as the ability to zoom in on a specific area of the recording, or to cross-reference the layout shift with other performance data, browser rendering events, network activity, and more.
Layout shift summary
You've seen how hovering over a layout shift in the Performance Panel gives you a visual representation of the layout shift, but you can also click on an individual layout shift, or a layout shift cluster, to see more details in the Summary Panel.
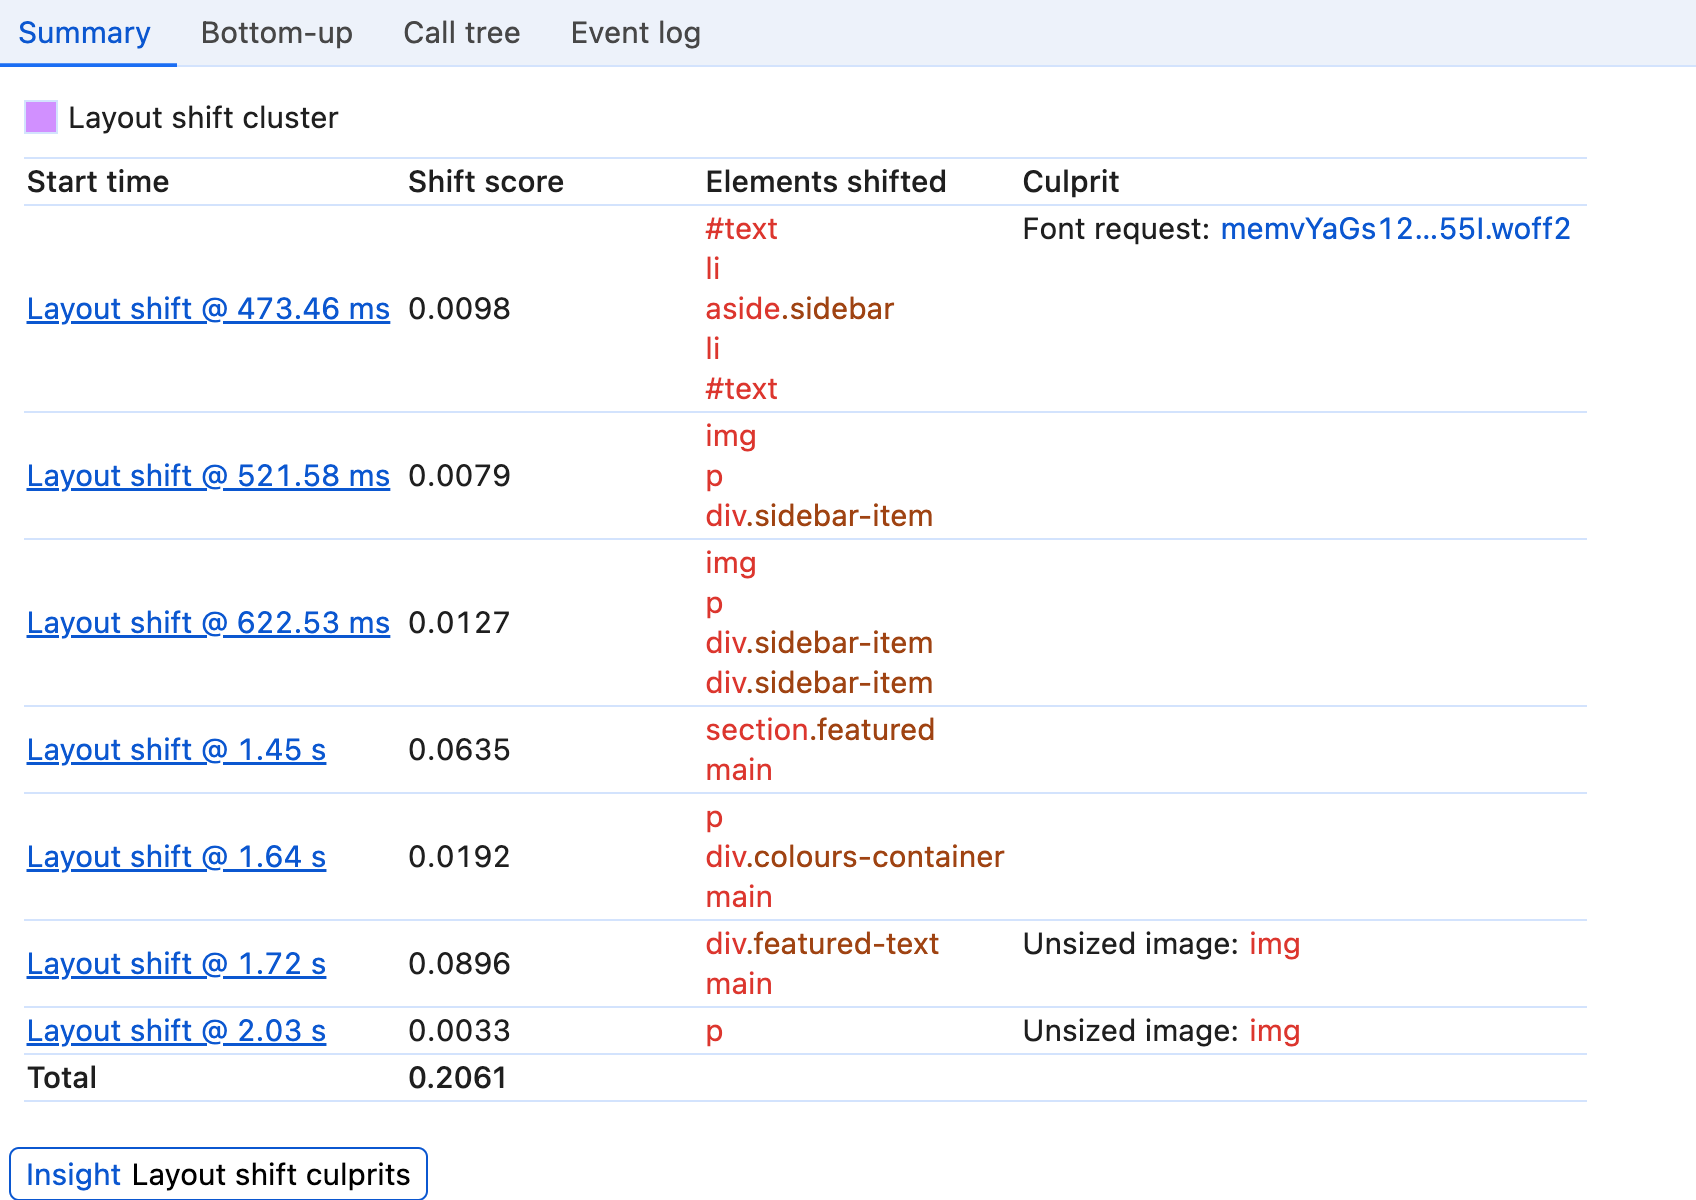
The Summary panel offers a more detailed view of the layout shift (or layout shift cluster), including the elements that were involved in the layout shift, the layout shift score, the culprit and a start time.
Where a culprit is identified, you'll see a Culprit label such as:
- Injected iframe: This layout shift was caused by an iframe that was injected into the page.
- Font request: This layout shift was caused by a web font request, which caused elements to shift around as the font loaded.
- Unsized images: This layout shift was caused by an image that didn't have dimensions specified in the HTML. This meant that the browser didn't know how much space to allocate for the image, and when the image loaded, it caused a layout shift.
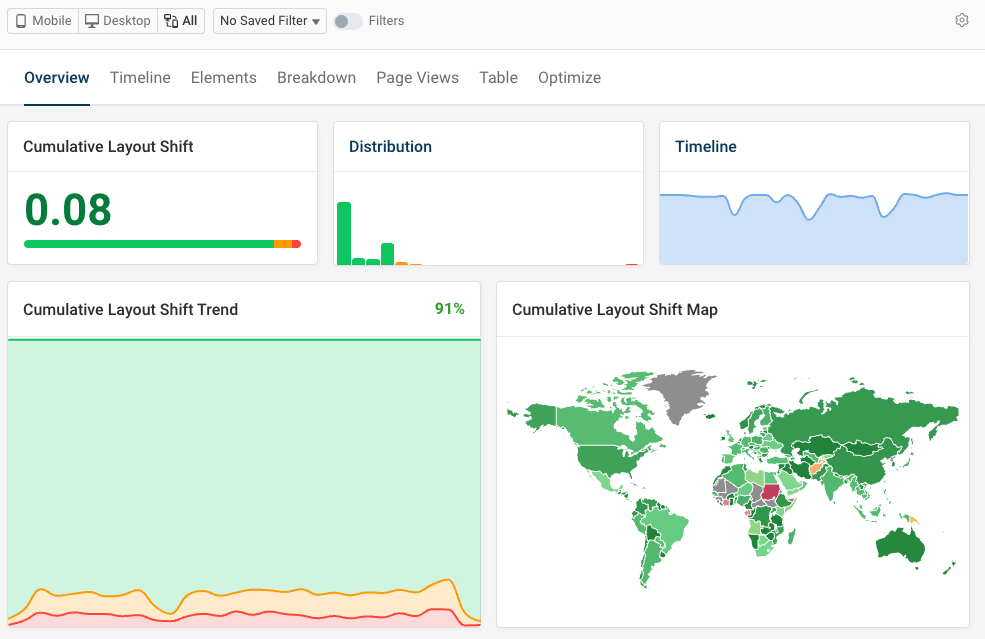
View layout shift culprits in DebugBear
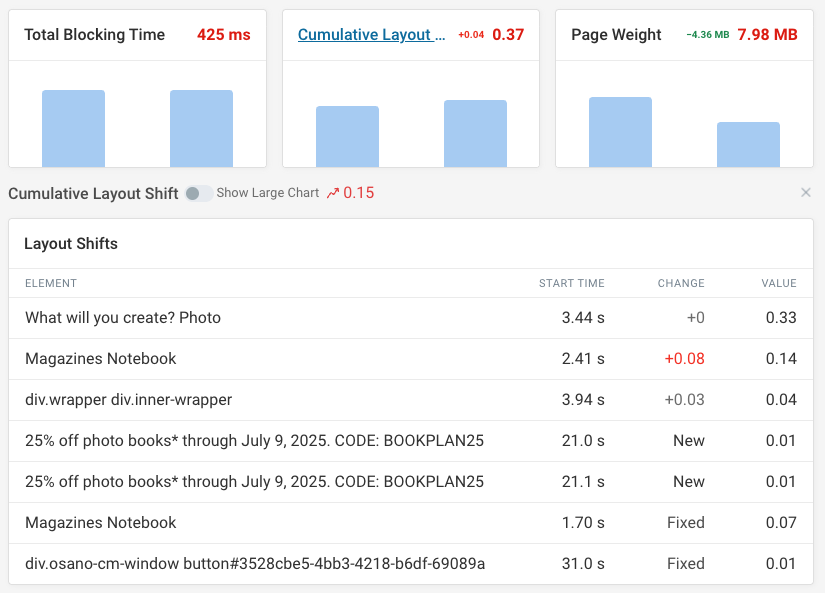
DebugBear monitoring or the free website speed test can also report layout shifts and help you identify what's caused them. You can also track your CLS scores over time.
Each layout shift can have multiple source elements, and the DebugBear test lets you see each individual shift.
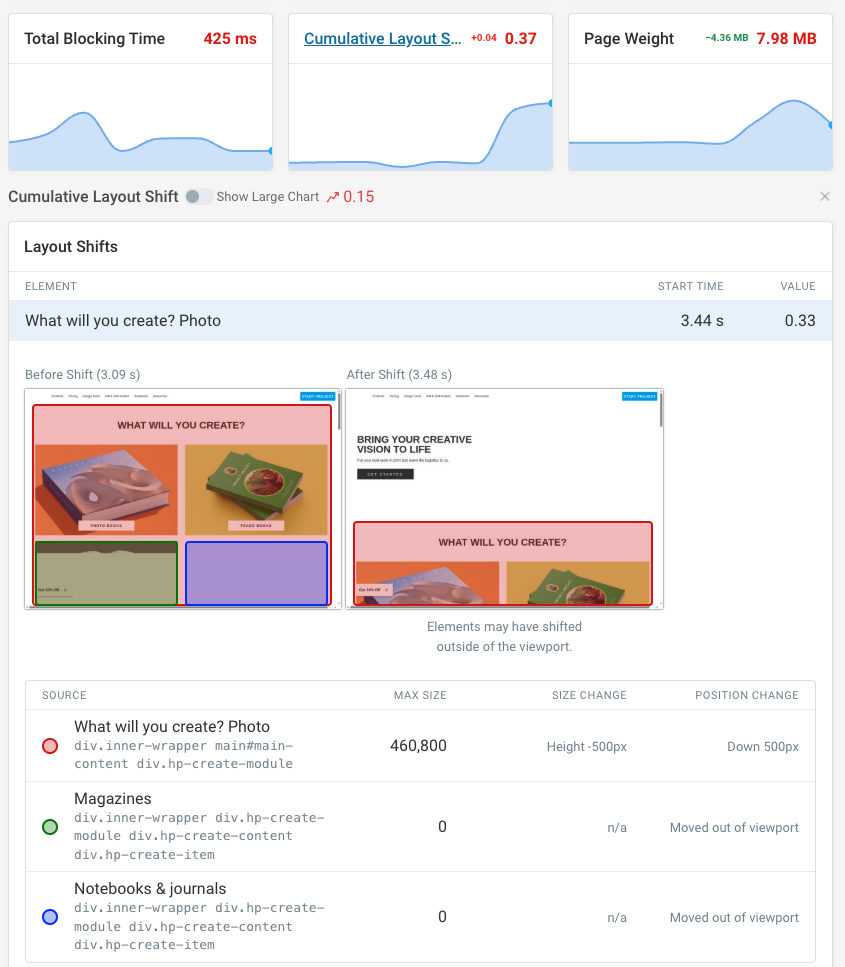
You can also debug CLS regressions by enabling Compare mode. You can see any new layout shift entries or which layout shifts have become more severe.
From there you can visually compare the user impact before and after, as well as checking if new source elements are impacted.
How to identify what layout shifts are impacting real users
It's not always clear what layout shifts are problematic for real users. Especially as some layout shifts happen after an interaction, or are only visible on certain devices.
A solution to this problem is to use a Real User Monitoring solution like DebugBear, that has built-in support for layout shift tracking. You can see which layout shifts are impacting real users, and how they're affecting your Core Web Vitals scores.

Track Cumulative Layout Shift and other Core Web Vitals over time, and identify specific pages and visitor segments where you need to optimize.
When your scores get worse, DebugBear can send out alerts over email, Slack, or in Microsoft Teams.


Monitor Page Speed & Core Web Vitals
DebugBear monitoring includes:
- In-depth Page Speed Reports
- Automated Recommendations
- Real User Analytics Data