
Lighthouse runs tests on a relatively slow throttled connection, so typically real user field data is worse than what's reported in lab tests.
However, sometimes it's the opposite and real users face performance problems on a superficially fast site. This article looks at a number of reasons why TTFB values differ between lab and field measurements.
TTFB vs server response time
First of all, the Time to First Byte metric includes more than just server response time for the HTTP request.
- Redirects
- Time spent establishing a server connection
- Network round trip time for the request
- Server processing time
The server response time in Lighthouse only measures the processing time component. However, the Google CrUX data that impacts rankings includes all components in the TTFB score.
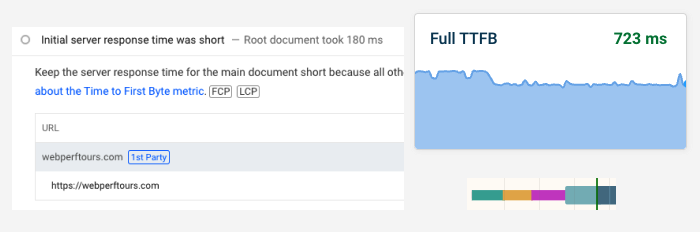
Why is lab test TTFB typically worse than field data?
When running a lab test on PageSpeed Insights or DebugBear you'll typically find that field TTFB is better than what's shown in the lab data. This has two reasons:
- Mobile Lighthouse tests use a high-latency network with a round trip time of 150 milliseconds
- Most lab tests measure a first visit "cold load", with no browser caching or server connection reuse
With a round trip time of 150 milliseconds, a request will take at least 600 milliseconds even if the server response is instant.
What does it mean if real user TTFB is worse than lab results?
While this situation is less common, it can happen for a few reasons:
- Logged-in users having a slower experience
- CDN and application cache misses
- Users arriving via redirects
Logged-in users having a slower experience
Lab tests are typically run on public pages without login, although you can configure login flows to test pages that require authentication.
When users are logged in the content they see often includes customized information and private data. Therefore caching is not an option and the full page has to be regenerated.
If you're logged into a CMS like Wordpress you may also find that page speed is a lot slower for you than it is for other visitors.
CDN and application cache misses
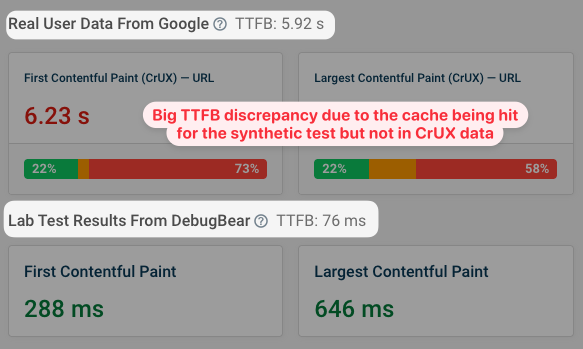
Another reason is that lab tests are run from a consistent location and are more likely to hit a cache than a random visitor.
Global CDN caching
CDN caching works by serving content from an edge node that's close to the user. For example, Cloudflare has 330 global edge nodes.
Content Delivery Networks can then cache some server responses at the edge node and respond to requests within milliseconds. However, this only works if the specific edge node that's serving the user has already cached the HTML.
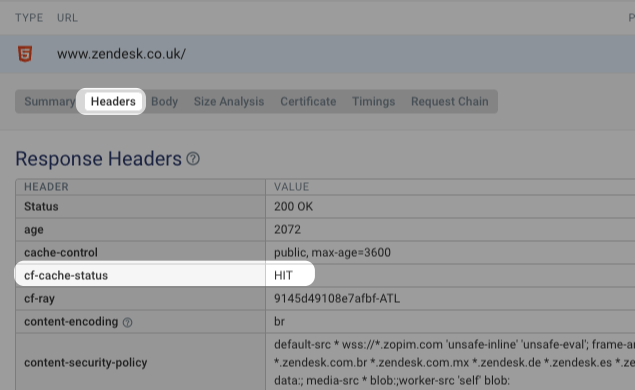
You can view the CDN status in the response headers of the HTTP request. For example, Cloudflare's CDN returns a cf-cache-status response header with the value HIT when the response is served from the edge node cache.
Application-level caching
You can also cache responses in your application code or content management systems (CMS). If lab results look fine but your pages load slowly for real users this might be because lab visits hit the cache while real users don't.
If you see this happening, check your cache expiration settings. If responses are only cached for an hour, but a page only receives a few visits a day, then visitors won't hit the cache.
The application level cache will usually be cleared when you publish a new version of your website. Many plugins for Wordpress and other content management systems allow you to pre-warm the cache, so that performance doesn't degrade after a new release.
Query parameters causing cache misses
Query parameters are often part of a URL, like this for example:
http://sth.com/book?location=NYC&utm_campaign=ad-5&gclid=g78e73
Some query parameters impact what content is rendered, for example the location parameter in our example URL.
However, others are added for analytics reasons, for example utm_campaign, gclid, fbclid, or ref. They don't change the content that is rendered. Cloudflare has a published a longer list of these parameters and how they impact caching on Cloudflare.
Check your caching setup to ensure that query parameters that don't impact the content aren't part of the cache key. Otherwise you won't see the benefit from caching, as each users will have a unique URL.
Users arriving via redirects
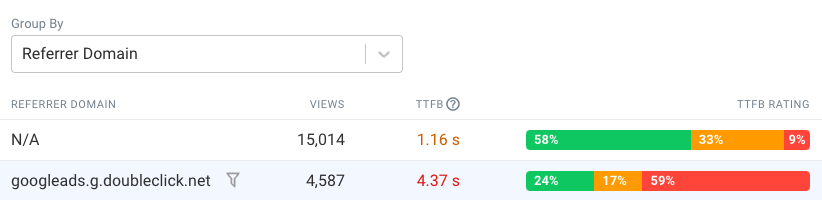
HTTP redirects between pages and domains can also increase TTFB. While you might be testing the destination page directly, your visitors might click on a googleadservices.com URL and then be redirected to your website. That means the full TTFB value actually measures two requests, not one.
If you have real user monitoring in place you can break down your data by referrer or UTM campaign to see if specific campaigns are impacting your Core Web Vitals data.
Tips to improve real user TTFB
What are some concrete steps you can take to improve page load time for real users specifically?
- Enable caching at the CDN or application level
- Enable browser caching
- Extend cache durations so data doesn't expire quickly
- Prewarm caches after invalidating cache entries
Be careful with origin and URL level data
Sometimes you'll see this in your data:
- All pages with URL-level data show good Core Web Vitals
- The origin as a whole is reported as having poor Core Web Vitals
What's going on here? It's often a caching issue.
Google only provides URL-level CrUX data when a page has reached a certain traffic threshold. Pages that get accessed frequently are also more likely to be in the CDN or application cache.
However, most of your website traffic might also be going to long tail pages that only receive a trickle of visits. At the origin level this will dominate your data. But cache hits here are less likely since cache entries expire when a lot of time passes between visits.
So when a visitor goes to your less popular pages they are likely to not hit any caches and your web server has to regenerate the page. If this is slow you'll see poor performance at the origin level.
You can fix this in two ways:
- Extending cache durations
- Investigating your backend logic and optimizing it
Monitor lab and real user Core Web Vitals data
Lab data and real user data are both useful to understand how you can improve the performance of your website.
DebugBear combines both data types in one product, giving you a comprehensive view of your Core Web Vitals. Stay on top of your data and get alerted when there's a problem.
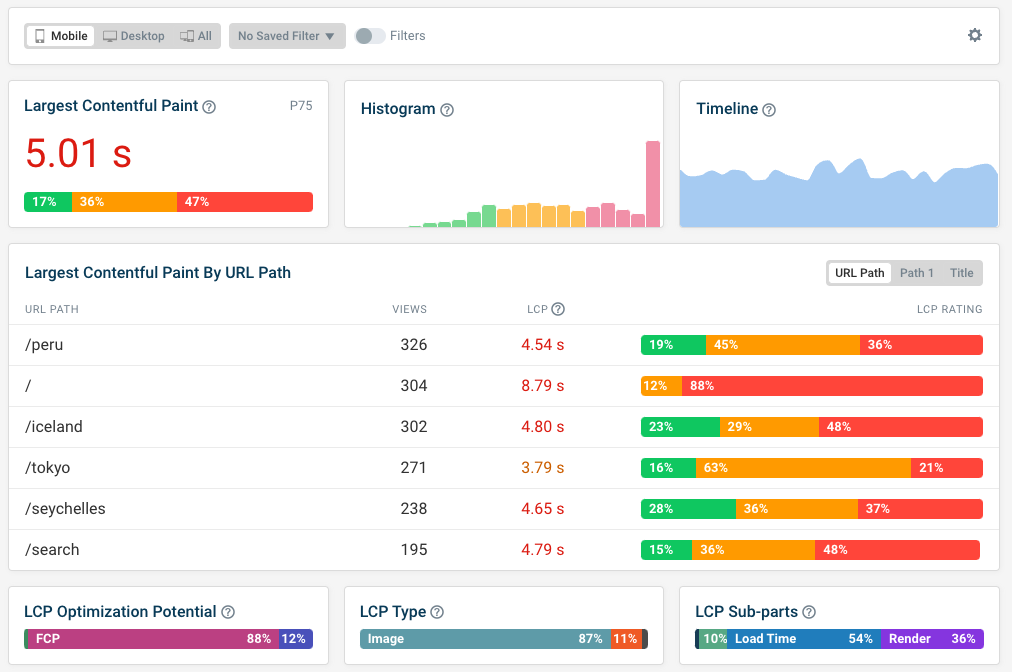
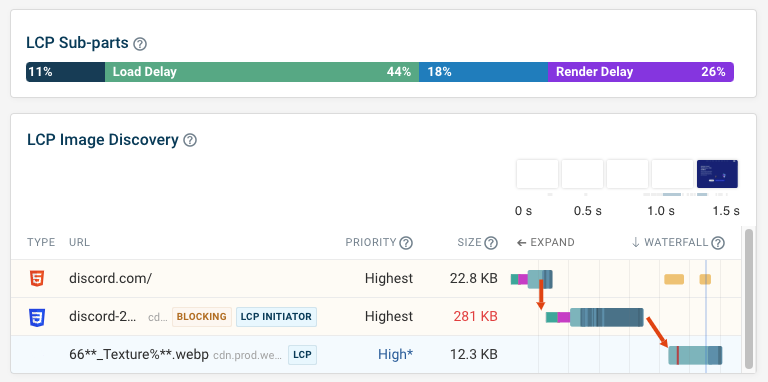
In addition to monitoring your page speed, DebugBear also includes in-depth custom reports to help you investigate page speed issues.
Monitor Page Speed & Core Web Vitals
DebugBear monitoring includes:
- In-depth Page Speed Reports
- Automated Recommendations
- Real User Analytics Data